Technical Analysis of MTGP 2024-05-10
Overview:
In analyzing the technical indicators for MTGP over the last 5 days, we will delve into the trend, momentum, volatility, and volume indicators to provide a comprehensive outlook on the possible stock price movement in the coming days. By examining these key indicators, we aim to offer valuable insights and predictions for informed decision-making.
Trend Analysis:
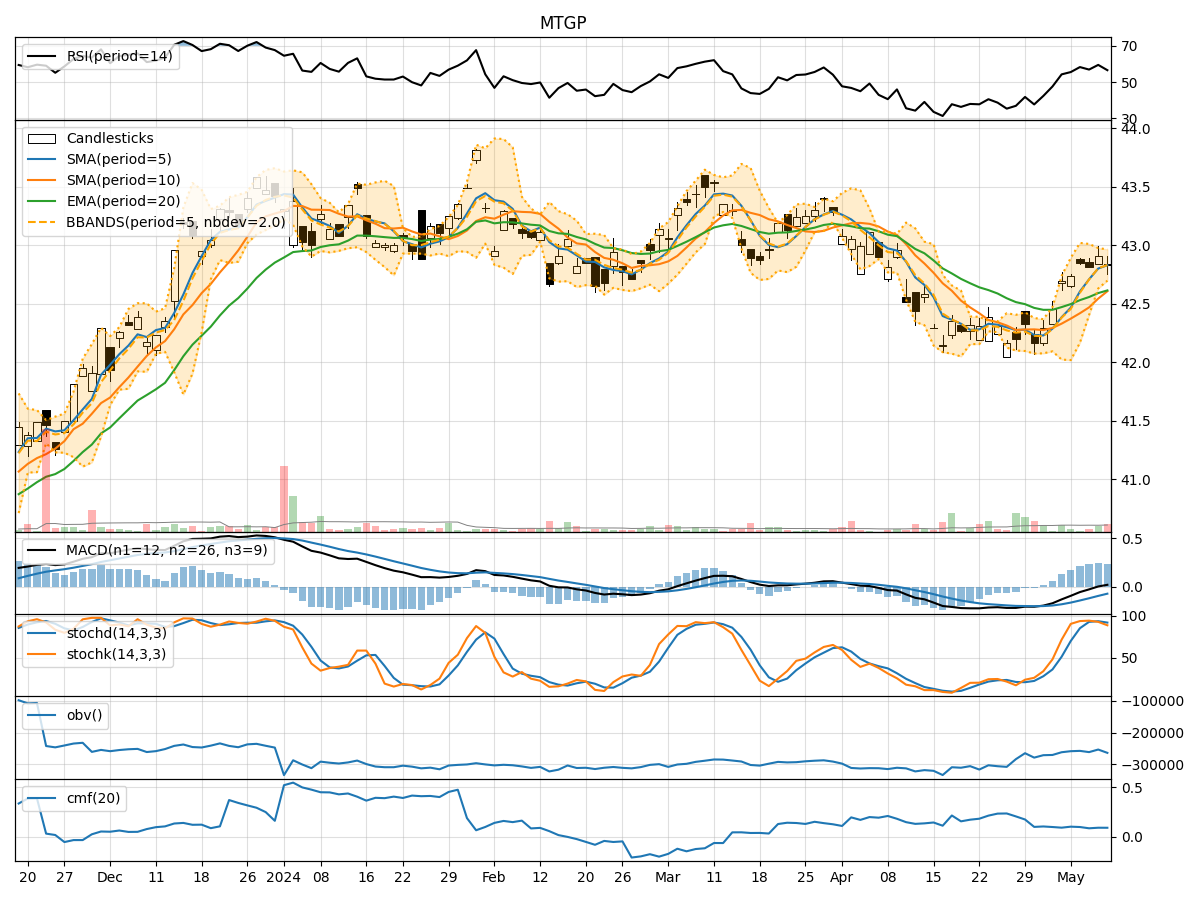
- Moving Averages (MA): The 5-day Moving Average (MA) has been consistently above the Simple Moving Average (SMA) and Exponential Moving Average (EMA), indicating a bullish trend.
- MACD: The MACD line has been positive, with the MACD Histogram showing an increasing trend, suggesting bullish momentum.
Momentum Analysis:
- RSI: The Relative Strength Index (RSI) has been in the neutral zone around 50-60, indicating a balanced momentum.
- Stochastic Oscillator: Both %K and %D have been fluctuating in the overbought region, suggesting a potential reversal or consolidation.
Volatility Analysis:
- Bollinger Bands (BB): The stock price has been trading within the Bollinger Bands, with the bands narrowing, indicating decreasing volatility.
Volume Analysis:
- On-Balance Volume (OBV): The OBV has shown mixed signals, with no clear trend in volume accumulation or distribution.
- Chaikin Money Flow (CMF): The CMF has been relatively stable, indicating a neutral sentiment towards the stock.
Key Observations:
- The trend indicators suggest a bullish bias, supported by the positive MACD and moving averages.
- Momentum indicators show a mixed picture, with RSI in a neutral zone and stochastic oscillators signaling potential overbought conditions.
- Volatility has been decreasing, indicating a possible period of consolidation or a lack of significant price movements.
- Volume indicators do not provide a clear direction, reflecting uncertainty in market participation.
Conclusion:
Based on the analysis of the technical indicators, the next few days for MTGP could see sideways movement or consolidation. The bullish trend indicated by moving averages and MACD may face resistance due to the neutral momentum and lack of significant volume support. Traders should exercise caution and wait for clearer signals before making significant trading decisions.