Technical Analysis of MTUL 2024-05-10
Overview:
In analyzing the technical indicators for MTUL over the last 5 days, we will delve into the trend, momentum, volatility, and volume indicators to provide a comprehensive outlook on the possible stock price movement in the coming days. By examining these key indicators, we aim to offer valuable insights and predictions for potential investors.
Trend Indicators:
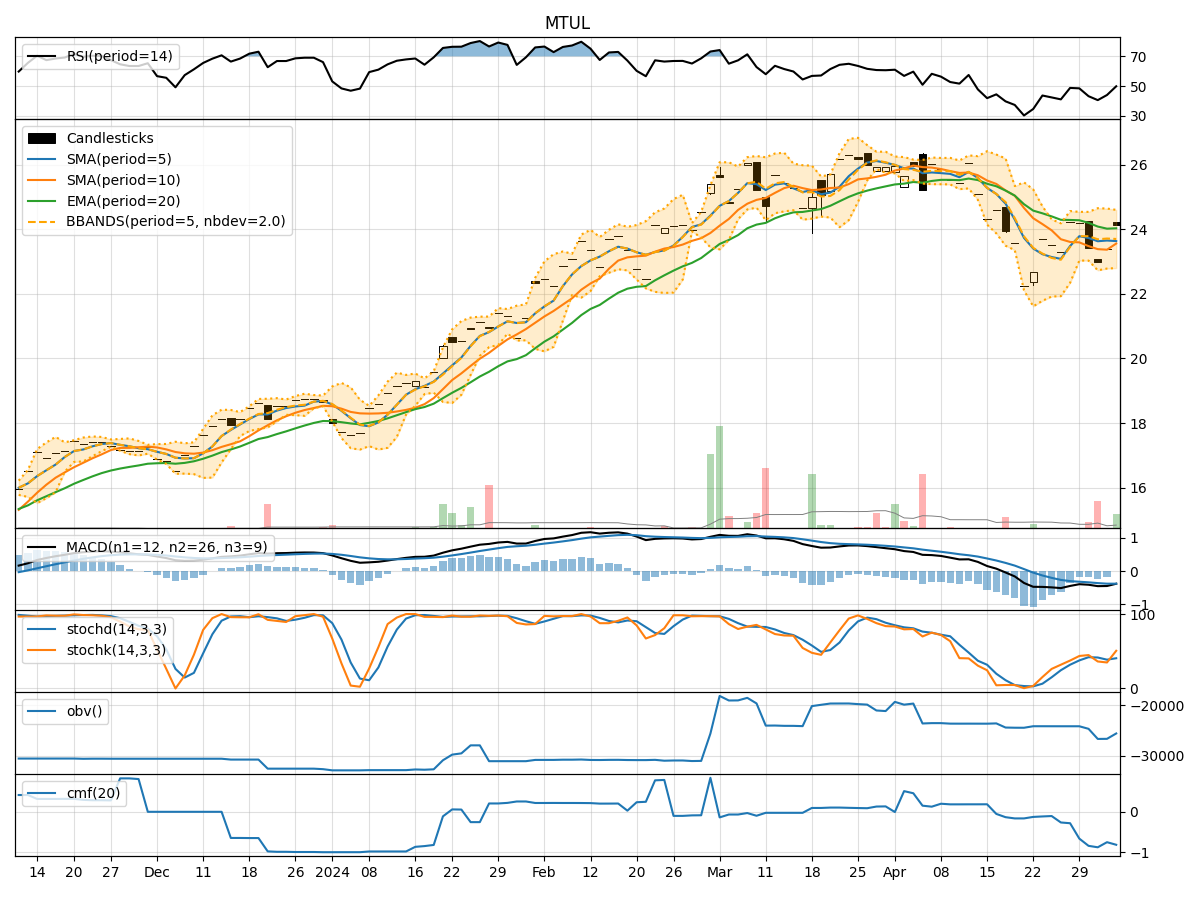
- Moving Averages (MA): The moving averages have been showing an upward trend, with the 5-day MA consistently above the longer-term SMAs and EMAs. This indicates a positive momentum in the stock price.
- MACD: The MACD line has been consistently above the signal line, suggesting a bullish trend in the stock.
- MACD Histogram: The MACD histogram has been increasing over the past 5 days, indicating strengthening bullish momentum.
Momentum Indicators:
- RSI: The RSI has been gradually increasing and is currently in the neutral zone, indicating potential room for further upside movement.
- Stochastic Oscillator: Both %K and %D lines of the Stochastic Oscillator are in the overbought territory, suggesting a potential reversal or consolidation in the near future.
- Williams %R: The Williams %R is hovering around the oversold region, indicating a possible buying opportunity.
Volatility Indicators:
- Bollinger Bands: The Bollinger Bands have been widening, indicating increased volatility in the stock price. The current price is close to the upper band, suggesting a potential pullback or consolidation.
- Bollinger %B: The %B indicator is above 0.8, indicating that the stock is trading near the upper Bollinger Band, which may signal an overbought condition.
Volume Indicators:
- On-Balance Volume (OBV): The OBV has been relatively flat over the past 5 days, indicating a balance between buying and selling pressure.
- Chaikin Money Flow (CMF): The CMF is negative, suggesting that money is flowing out of the stock. This could indicate a bearish sentiment among investors.
Conclusion:
Based on the analysis of the technical indicators, the stock of MTUL is currently in an overbought state according to the Stochastic Oscillator and Williams %R. The Bollinger Bands also suggest a potential pullback or consolidation in the stock price due to the overbought condition. The MACD and RSI indicate a bullish trend, but caution is advised due to the overbought signals from other indicators.
In conclusion, while the stock may experience some near-term volatility or consolidation, the overall trend remains bullish. Investors should closely monitor the price action and key support/resistance levels to make informed decisions.