Technical Analysis of MTUM 2024-05-10
Overview:
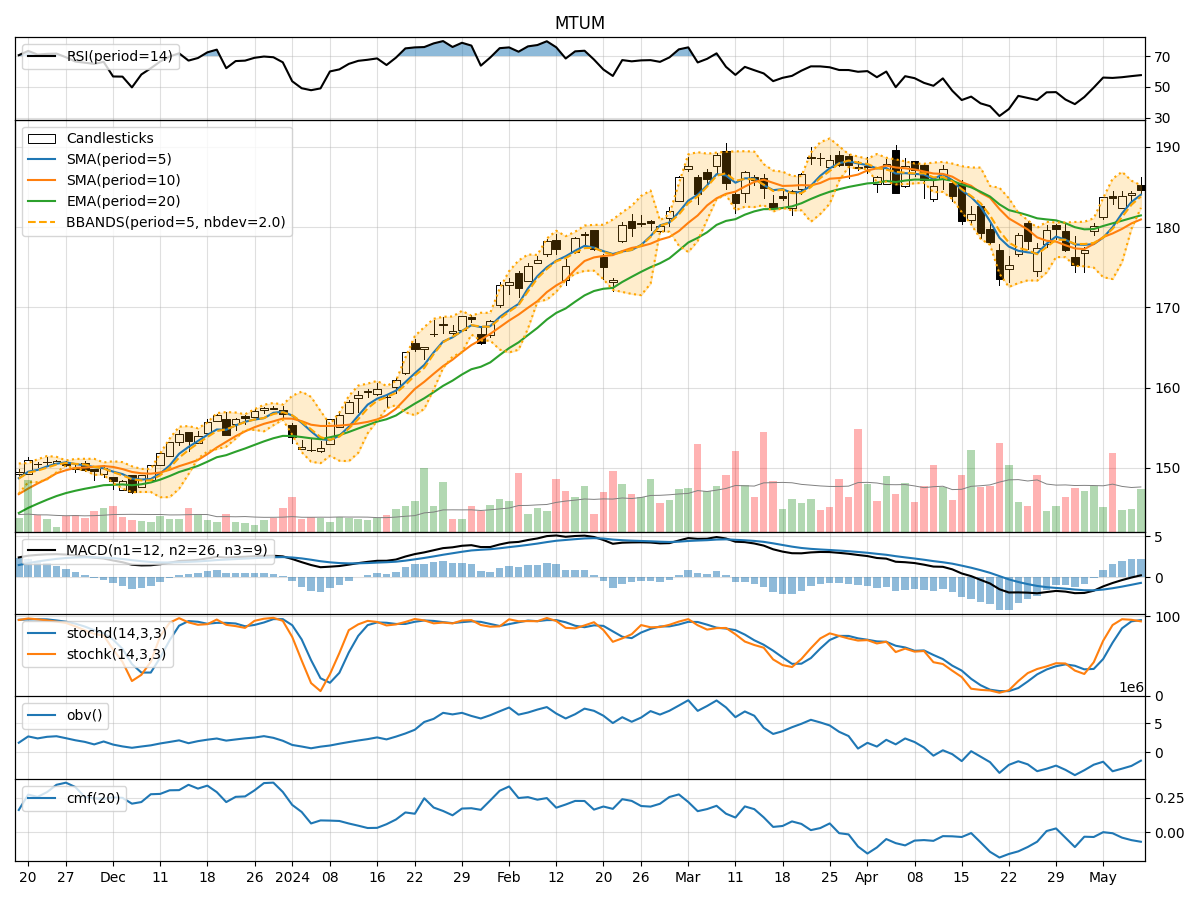
In the last 5 trading days, MTUM has shown a consistent uptrend in its stock price, with increasing volumes. The moving averages have been trending upwards, indicating a bullish sentiment. Momentum indicators like RSI and Stochastic oscillators suggest the stock is in overbought territory. Volatility indicators show a narrowing of the Bollinger Bands, indicating a potential decrease in volatility. Volume indicators like OBV and CMF suggest a slight decrease in buying pressure.
Trend Indicators:
- Moving Averages (MA): The 5-day MA has been consistently above the longer-term SMAs and EMAs, indicating a strong bullish trend.
- MACD: The MACD line has been consistently above the signal line, indicating bullish momentum.
- MACD Histogram: The histogram has been increasing, indicating strengthening bullish momentum.
Momentum Indicators:
- RSI: The RSI is in overbought territory, suggesting a potential reversal or consolidation.
- Stochastic Oscillators: Both %K and %D are in overbought territory, indicating a potential pullback.
- Williams %R: The indicator is in oversold territory, suggesting a potential reversal.
Volatility Indicators:
- Bollinger Bands: The bands have been narrowing, indicating decreasing volatility.
- Bollinger %B: The %B is close to 1, suggesting the stock is trading near the upper band.
Volume Indicators:
- On-Balance Volume (OBV): The OBV has been slightly decreasing, indicating a decrease in buying pressure.
- Chaikin Money Flow (CMF): The CMF is negative, suggesting a slight outflow of money from the stock.
Conclusion:
Based on the technical indicators and analysis: - Trend: The stock is in a strong upward trend. - Momentum: The momentum indicators suggest a potential pullback due to overbought conditions. - Volatility: Volatility is decreasing, indicating a possible period of consolidation. - Volume: Buying pressure is slightly decreasing based on volume indicators.
Overall View:
Considering the technical indicators, the stock is likely to experience a short-term pullback or consolidation after the recent strong uptrend. Traders may consider taking profits or waiting for a better entry point. Long-term investors can use any pullback as an opportunity to add to their positions in line with the overall bullish trend.