Technical Analysis of MUSI 2024-05-10
Overview:
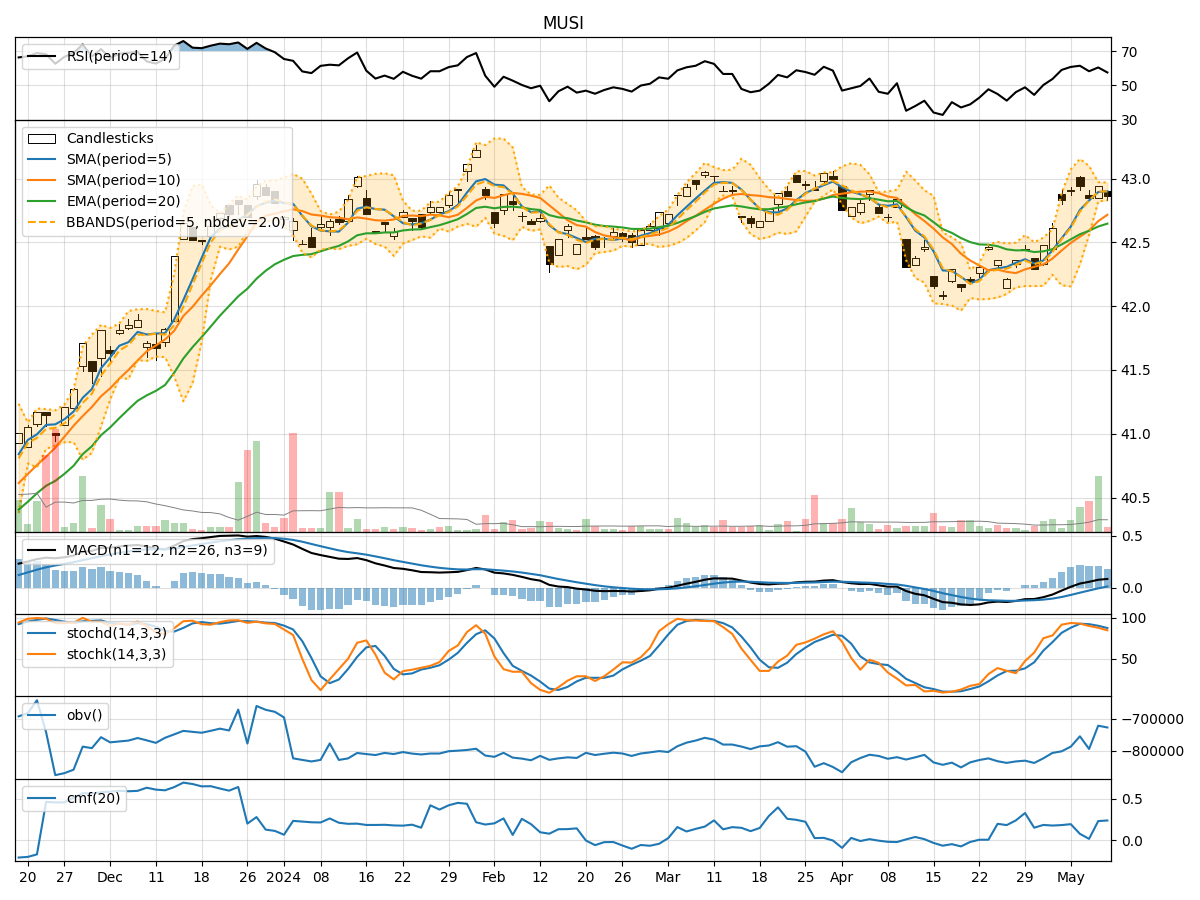
In analyzing the technical indicators for MUSI stock over the last 5 days, we will delve into the trend, momentum, volatility, and volume indicators to provide a comprehensive outlook on the possible stock price movement in the coming days. By examining these key indicators, we aim to offer valuable insights and predictions for informed decision-making.
Trend Analysis:
- Moving Averages (MA): The 5-day Moving Average (MA) has been consistently above the Simple Moving Average (SMA) and Exponential Moving Average (EMA), indicating a bullish trend.
- MACD: The MACD line has been consistently above the signal line, with both lines showing an upward trend, suggesting bullish momentum.
- RSI: The Relative Strength Index (RSI) has been fluctuating around the 60-61 range, indicating neutral momentum.
Momentum Analysis:
- Stochastic Oscillator: The Stochastic Oscillator has been gradually decreasing but remains in the overbought territory, suggesting a potential reversal.
- Williams %R: The Williams %R indicator has been fluctuating in the oversold region, indicating potential buying opportunities.
Volatility Analysis:
- Bollinger Bands (BB): The stock price has been trading within the Bollinger Bands, with the bands narrowing, indicating reduced volatility.
- Bollinger %B: The %B indicator has been hovering around 0.2-0.8 range, suggesting potential consolidation.
Volume Analysis:
- On-Balance Volume (OBV): The OBV indicator has shown mixed movements, indicating indecisiveness in volume flow.
- Chaikin Money Flow (CMF): The CMF has been positive but relatively flat, suggesting neutral volume pressure.
Conclusion:
Based on the analysis of the technical indicators, the stock is currently exhibiting a bullish bias in trend and momentum. However, the momentum indicators are showing signs of potential reversal due to overbought conditions. The volatility is contracting, indicating a possible period of consolidation. The volume indicators suggest indecisiveness in volume flow.
Forecast:
Considering the overall analysis, the next few days may see the stock price experiencing consolidation with a slight downward bias as the momentum indicators hint at a potential reversal. Traders should closely monitor the Stochastic Oscillator for a possible reversal signal and the Bollinger Bands for any breakout or reversal patterns. It is advisable to exercise caution and wait for clearer signals before making significant trading decisions.