Technical Analysis of MUSQ 2024-05-10
Overview:
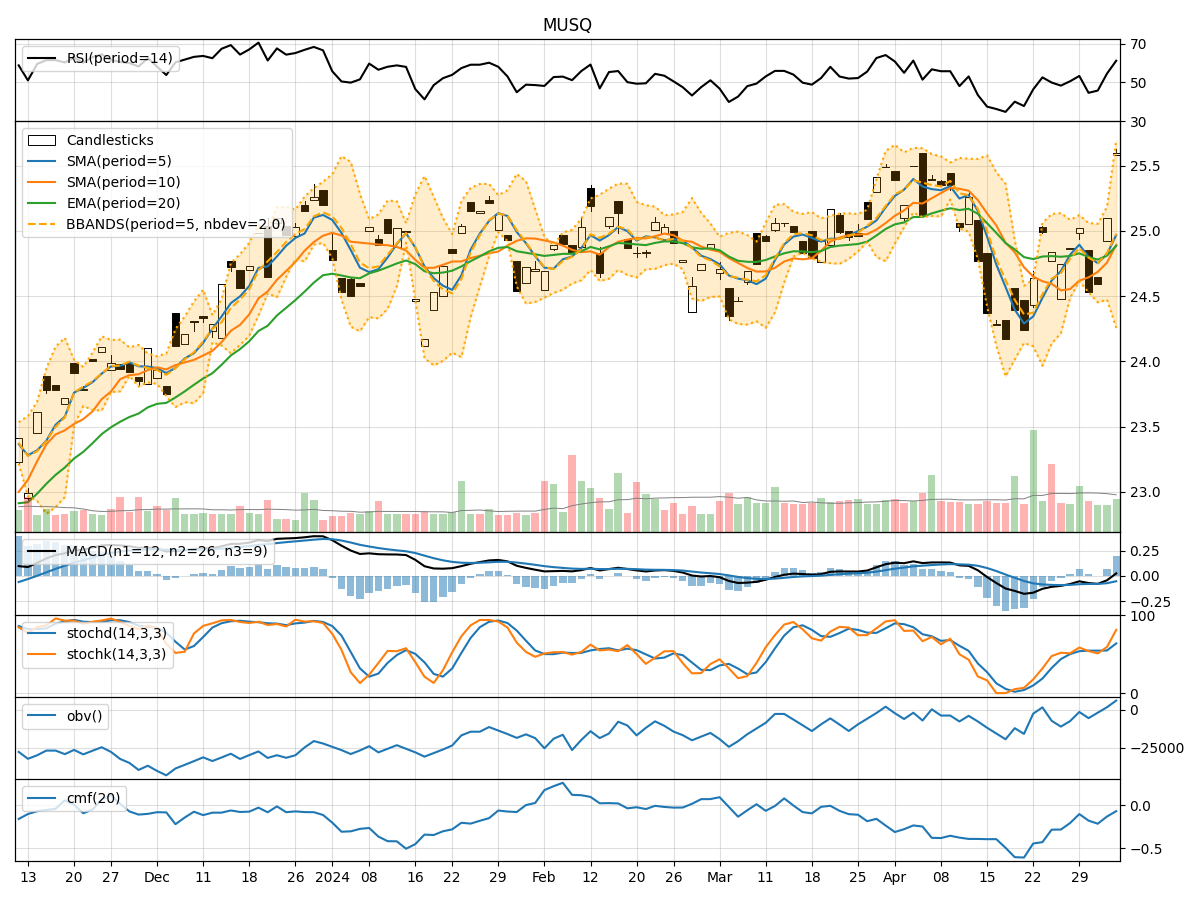
In analyzing the technical indicators for MUSQ over the last 5 days, we will delve into the trend, momentum, volatility, and volume indicators to provide a comprehensive outlook on the possible stock price movement in the coming days.
Trend Analysis:
- Moving Averages (MA): The 5-day Moving Average (MA) has been fluctuating around the closing prices, indicating short-term price trends.
- MACD: The Moving Average Convergence Divergence (MACD) has shown positive values, suggesting a bullish momentum.
- EMA: The Exponential Moving Average (EMA) has been relatively stable, reflecting a smoother trend.
Momentum Analysis:
- RSI: The Relative Strength Index (RSI) has been moderate, indicating neither overbought nor oversold conditions.
- Stochastic Oscillator: Both %K and %D have been declining, signaling a potential bearish momentum.
- Williams %R: The Williams %R has been in oversold territory, suggesting a possible reversal.
Volatility Analysis:
- Bollinger Bands (BB): The Bollinger Bands have been narrowing, indicating decreasing volatility.
- BB %B: The %B indicator has been hovering around the middle, reflecting a balanced market sentiment.
Volume Analysis:
- On-Balance Volume (OBV): The OBV has been relatively stable, indicating a neutral volume trend.
- Chaikin Money Flow (CMF): The CMF has been negative, suggesting a bearish money flow.
Key Observations:
- The trend indicators show a mixed picture with a slight bullish bias.
- Momentum indicators suggest a potential shift towards bearish momentum.
- Volatility has been decreasing, indicating a possible consolidation phase.
- Volume indicators reflect a neutral to bearish sentiment in terms of money flow.
Conclusion:
Based on the analysis of the technical indicators, the next few days for MUSQ stock price movement could see sideways consolidation with a slight bearish bias. Traders should exercise caution and closely monitor key support and resistance levels for potential entry or exit points. It is advisable to wait for further confirmation from price action before making significant trading decisions.