Technical Analysis of MUST 2024-05-10
Overview:
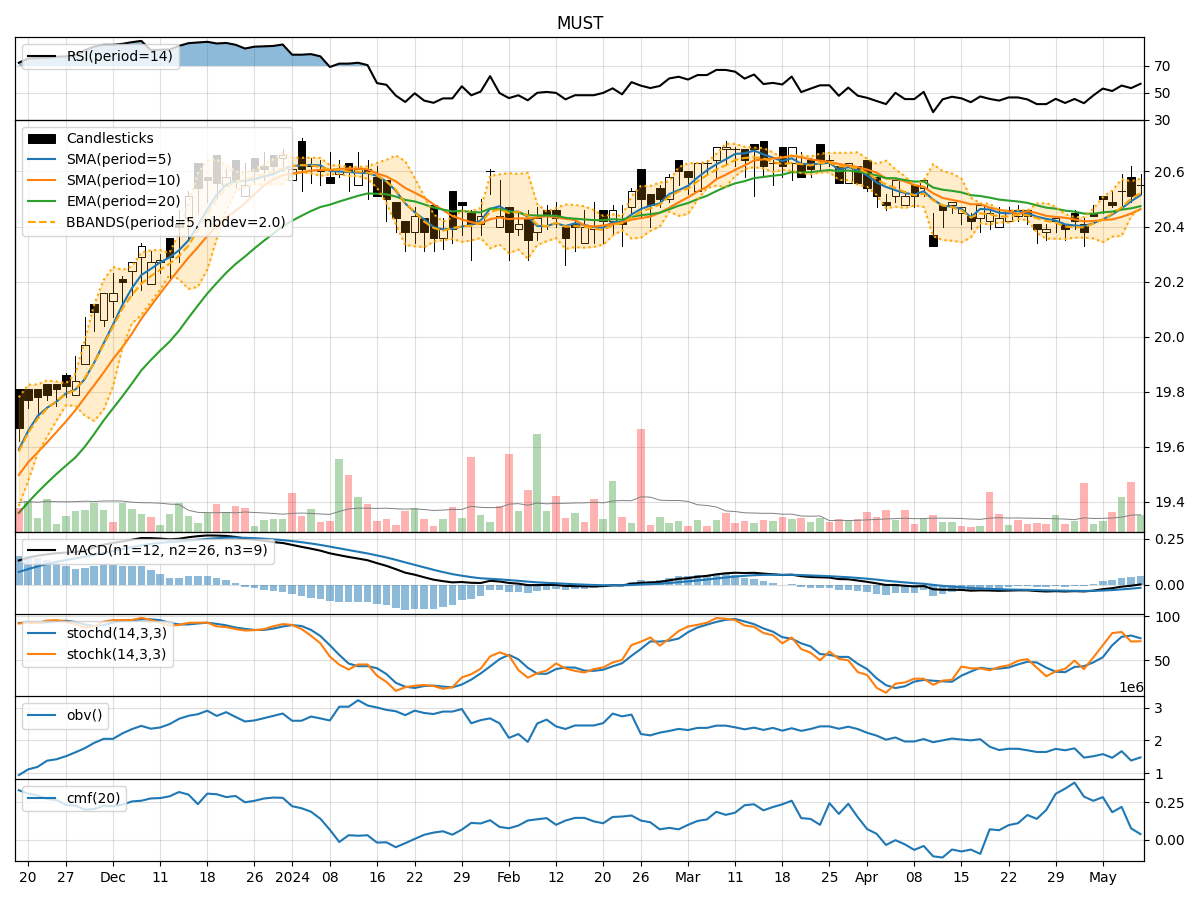
In analyzing the technical indicators for MUST stock over the last 5 days, we will delve into the trend, momentum, volatility, and volume indicators to provide a comprehensive outlook on the possible stock price movement in the coming days. By examining these key indicators, we aim to offer valuable insights and predictions to guide investment decisions.
Trend Analysis:
- Moving Averages (MA): The 5-day Moving Average (MA) has been steadily increasing, indicating a positive trend in the stock price.
- MACD: The Moving Average Convergence Divergence (MACD) has been consistently positive, suggesting bullish momentum in the stock.
- EMA: The Exponential Moving Average (EMA) has also been on an upward trajectory, supporting the bullish trend.
Momentum Analysis:
- RSI: The Relative Strength Index (RSI) has been fluctuating around the neutral zone, indicating a lack of strong momentum in either direction.
- Stochastic Oscillator: Both %K and %D have shown mixed signals, with no clear indication of overbought or oversold conditions.
- Williams %R: The Williams %R is hovering near the oversold territory, suggesting a potential reversal in the stock price.
Volatility Analysis:
- Bollinger Bands: The Bollinger Bands have shown narrowing volatility, indicating a potential decrease in price fluctuations.
- Bollinger %B: The %B indicator is currently below 1, suggesting the stock is trading below the upper Bollinger Band.
Volume Analysis:
- On-Balance Volume (OBV): The OBV has been fluctuating, indicating indecision among investors regarding the stock.
- Chaikin Money Flow (CMF): The CMF has been relatively low, signaling a lack of strong buying or selling pressure.
Conclusion:
Based on the analysis of the technical indicators, the stock of MUST is likely to experience sideways movement in the coming days. The trend indicators suggest a bullish bias, supported by the positive MACD and EMA. However, the momentum indicators show a lack of strong buying or selling pressure, leading to a consolidation phase. The volatility indicators point towards a decrease in price fluctuations, while the volume indicators indicate indecisiveness among investors.
In conclusion, while the stock may exhibit some bullish tendencies, the overall outlook suggests a period of consolidation and sideways movement. Investors should closely monitor key support and resistance levels for potential breakout opportunities.