Technical Analysis of MVFG 2024-05-10
Overview:
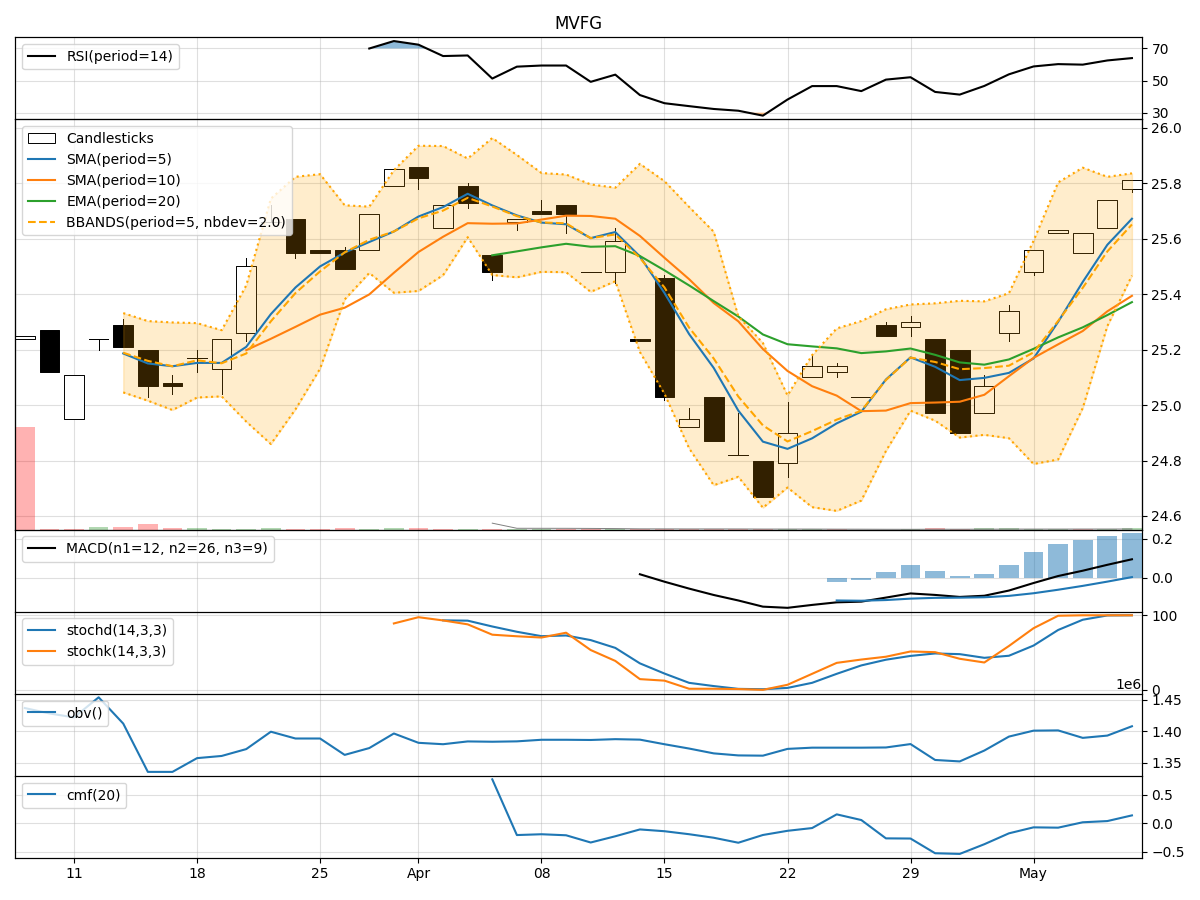
In analyzing the technical indicators for MVFG over the last 5 days, we will delve into the trend, momentum, volatility, and volume indicators to provide a comprehensive outlook on the possible stock price movement in the coming days. By examining these key aspects, we aim to offer valuable insights and predictions to guide your investment decisions.
Trend Analysis:
- Moving Averages (MA): The 5-day MA has been consistently above the closing prices, indicating a bullish trend.
- MACD: The MACD line has been above the signal line, suggesting a bullish momentum.
- EMA: The EMA has been trending upwards, supporting the bullish sentiment.
Momentum Analysis:
- RSI: The RSI has been in the overbought territory, indicating a strong bullish momentum.
- Stochastic Oscillator: Both %K and %D have been in the overbought zone, signaling a potential reversal.
- Williams %R: The indicator has been hovering around the oversold region, suggesting a possible bullish reversal.
Volatility Analysis:
- Bollinger Bands (BB): The stock price has been trading within the bands, indicating moderate volatility.
- BB Width: The bands have been relatively narrow, suggesting a period of consolidation.
- BB %B: The %B indicator has been fluctuating around the midline, reflecting a balanced market sentiment.
Volume Analysis:
- On-Balance Volume (OBV): The OBV has shown mixed signals, indicating indecision among investors.
- Chaikin Money Flow (CMF): The CMF has been slightly positive, suggesting some buying pressure.
Key Observations:
- The trend indicators point towards a bullish sentiment, supported by moving averages and MACD.
- Momentum indicators show a strong bullish momentum but also hint at a potential reversal due to overbought conditions.
- Volatility remains moderate, with Bollinger Bands indicating a period of consolidation.
- Volume indicators reflect mixed signals, with OBV showing indecision and CMF slightly positive.
Conclusion:
Based on the analysis of technical indicators, the stock price of MVFG is likely to experience a short-term consolidation phase. The bullish trend and momentum may lead to some upward movement, but the overbought conditions and mixed volume signals suggest a potential reversal or sideways movement in the coming days. Investors should closely monitor key support and resistance levels for potential entry or exit points. Exercise caution and consider implementing risk management strategies in light of the current market dynamics.