Technical Analysis of MVPA 2024-05-10
Overview:
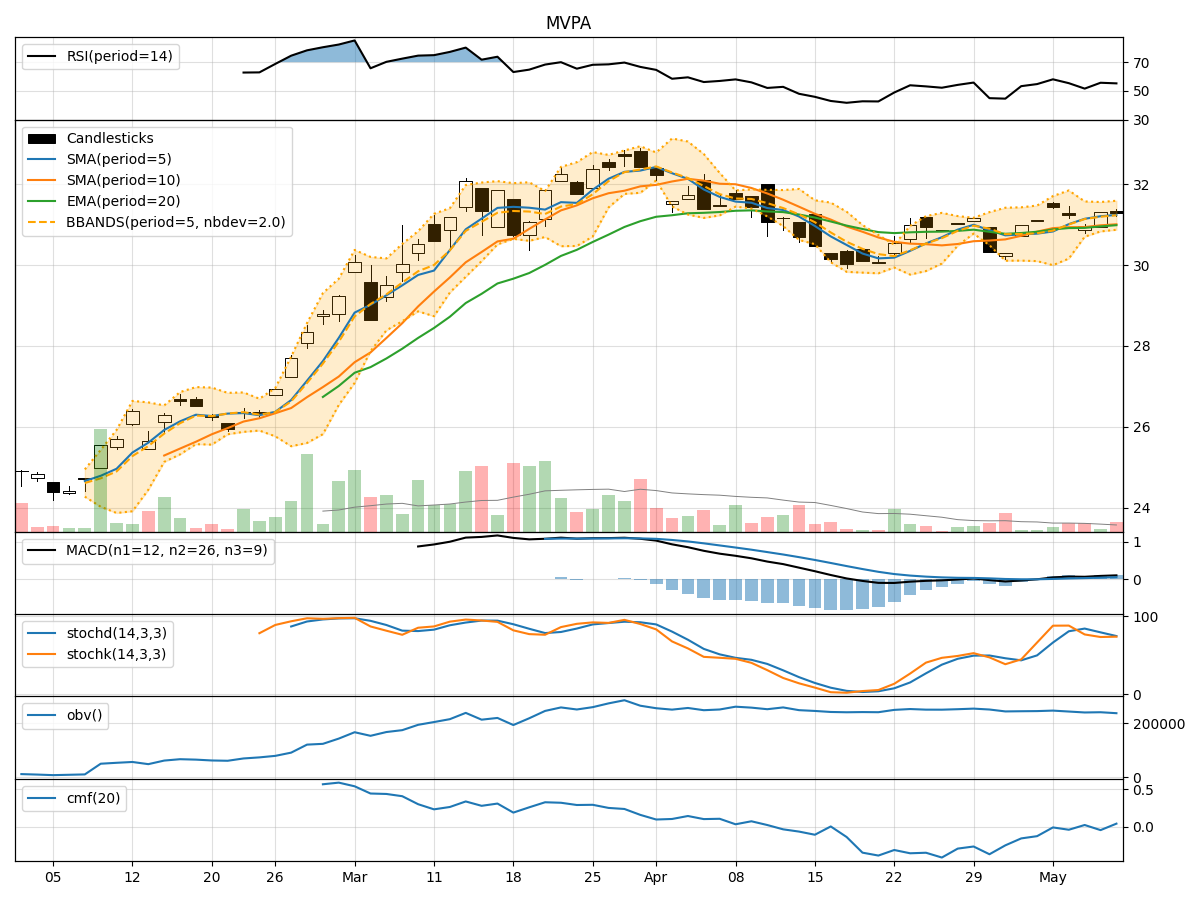
In analyzing the provided MVPA TA data for the last 5 days, we will delve into the technical indicators across trend, momentum, volatility, and volume to forecast the possible stock price movement in the upcoming days. By examining these indicators comprehensively, we aim to provide a well-informed prediction backed by data-driven insights and expert analysis.
Trend Analysis:
- Moving Averages (MA): The 5-day Moving Average (MA) has been consistently above the Simple Moving Average (SMA) and Exponential Moving Average (EMA), indicating a bullish trend.
- MACD: The MACD line has been consistently above the signal line, with both lines showing an upward trend, suggesting bullish momentum in the stock price.
Momentum Analysis:
- RSI: The Relative Strength Index (RSI) has been fluctuating around the 50 level, indicating a neutral momentum in the stock.
- Stochastic Oscillator: Both %K and %D lines of the Stochastic Oscillator have been moving in a range-bound manner, reflecting a lack of strong momentum direction.
Volatility Analysis:
- Bollinger Bands (BB): The stock price has been trading within the Bollinger Bands, with the bands narrowing in recent days, suggesting a potential decrease in volatility.
- Bollinger %B: The %B indicator is hovering around the middle range, indicating a balanced volatility level.
Volume Analysis:
- On-Balance Volume (OBV): The OBV indicator has shown mixed movements, reflecting indecision among market participants regarding the stock.
- Chaikin Money Flow (CMF): The CMF indicator has been fluctuating around the zero line, indicating a neutral money flow in and out of the stock.
Conclusion:
Based on the analysis of the technical indicators: - Trend: The stock is currently in an upward trend supported by the moving averages and MACD. - Momentum: The momentum indicators suggest a neutral stance with no clear direction. - Volatility: Volatility is decreasing, as indicated by the narrowing Bollinger Bands. - Volume: The volume indicators show mixed signals with no strong confirmation of buying or selling pressure.
Forecast:
Considering the overall analysis, the stock is likely to experience sideways consolidation in the near term, with a potential for a slight upward bias due to the bullish trend indicated by the moving averages and MACD. Traders may expect the stock price to trade within a narrow range with limited volatility. It is advisable to closely monitor the momentum indicators for any signs of a clear directional shift in the coming days.
In conclusion, the stock is expected to exhibit a consolidation phase with a slight bullish bias in the short term. Investors should exercise caution and wait for more definitive signals before making significant trading decisions.