Technical Analysis of MVPL 2024-05-10
Overview:
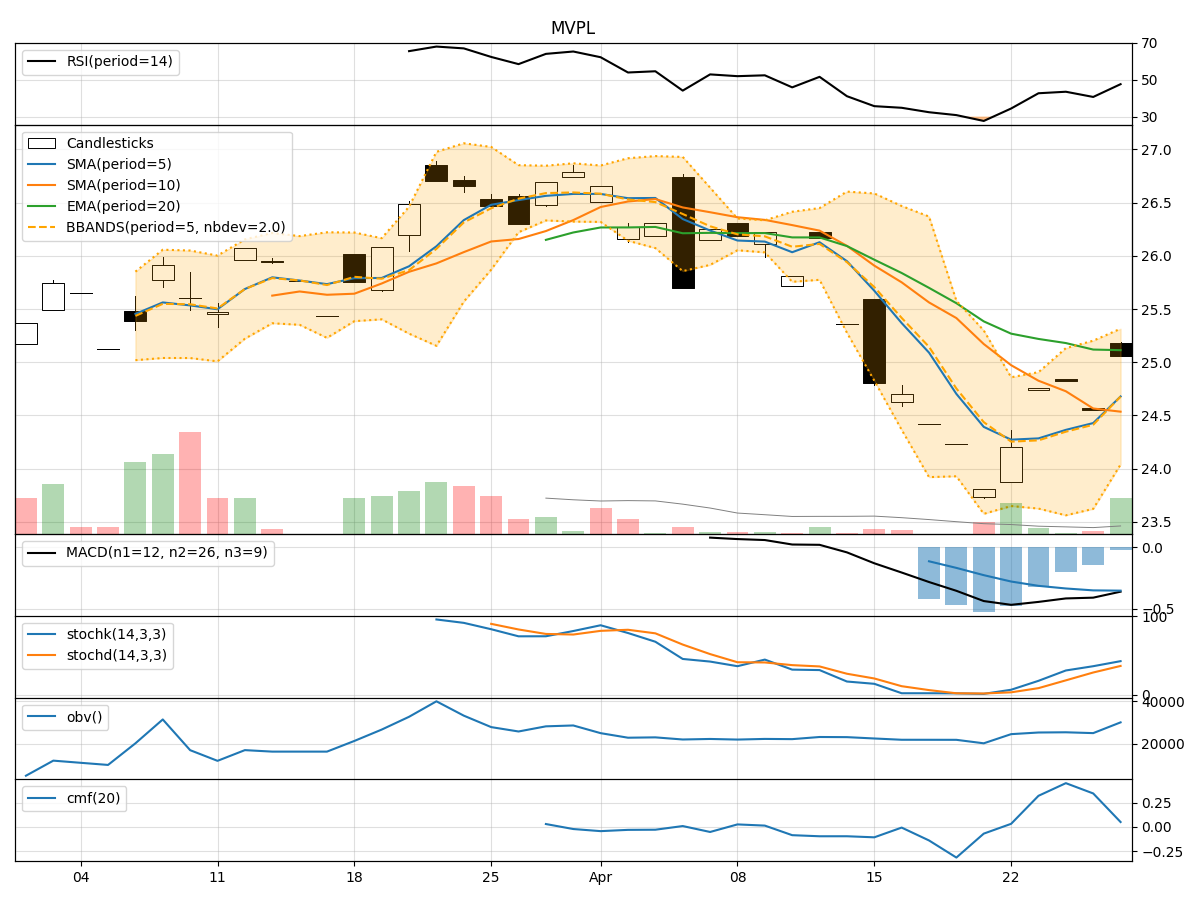
In analyzing the provided Technical Analysis (TA) data for the last 5 days, we will delve into the trend, momentum, volatility, and volume indicators to forecast the possible stock price movement for the next few days. By examining these key indicators, we aim to provide a comprehensive and insightful prediction backed by data-driven analysis.
Trend Indicators:
- Moving Averages (MA): The 5-day MA has been consistently rising, indicating a bullish trend in the short term.
- MACD (Moving Average Convergence Divergence): The MACD line has been above the signal line, suggesting a bullish momentum.
- MACD Histogram: The histogram has been increasing, indicating strengthening bullish momentum.
Momentum Indicators:
- RSI (Relative Strength Index): RSI has been trending upwards, signaling increasing buying pressure.
- Stochastic Oscillator: Both %K and %D have been at 100%, indicating overbought conditions.
- Williams %R (Willams Percent Range): The indicator has been at 0, suggesting the stock is in the oversold territory.
Volatility Indicators:
- Bollinger Bands: The stock price has been trading within the bands, with the %B indicating the price is close to the upper band.
- Volatility: The volatility has been decreasing, which could indicate a potential decrease in price fluctuations.
Volume Indicators:
- On-Balance Volume (OBV): The OBV has been relatively flat, indicating a balance between buying and selling pressure.
- Chaikin Money Flow (CMF): The CMF has been negative, suggesting outflows from the stock.
Key Observations and Opinions:
- Trend: The stock is in a strong bullish trend based on moving averages and MACD.
- Momentum: The momentum indicators suggest overbought conditions, which could lead to a potential pullback.
- Volatility: Decreasing volatility may indicate a period of consolidation or a potential decrease in price movements.
- Volume: The volume indicators show a lack of significant buying or selling pressure.
Conclusion:
Based on the analysis of the technical indicators, the stock is currently in an overbought state with strong bullish momentum. However, the decreasing volatility and lack of significant volume movements suggest a possible consolidation phase in the near future. Traders should be cautious of a potential pullback or sideways movement in the stock price.