Technical Analysis of MVPS 2024-05-10
Overview:
In analyzing the technical indicators for MVPS stock over the last 5 days, we will delve into the trend, momentum, volatility, and volume indicators to provide a comprehensive outlook on the possible stock price movement in the upcoming days. By examining key metrics such as moving averages, MACD, RSI, Bollinger Bands, and OBV, we aim to offer valuable insights and predictions for informed decision-making.
Trend Indicators:
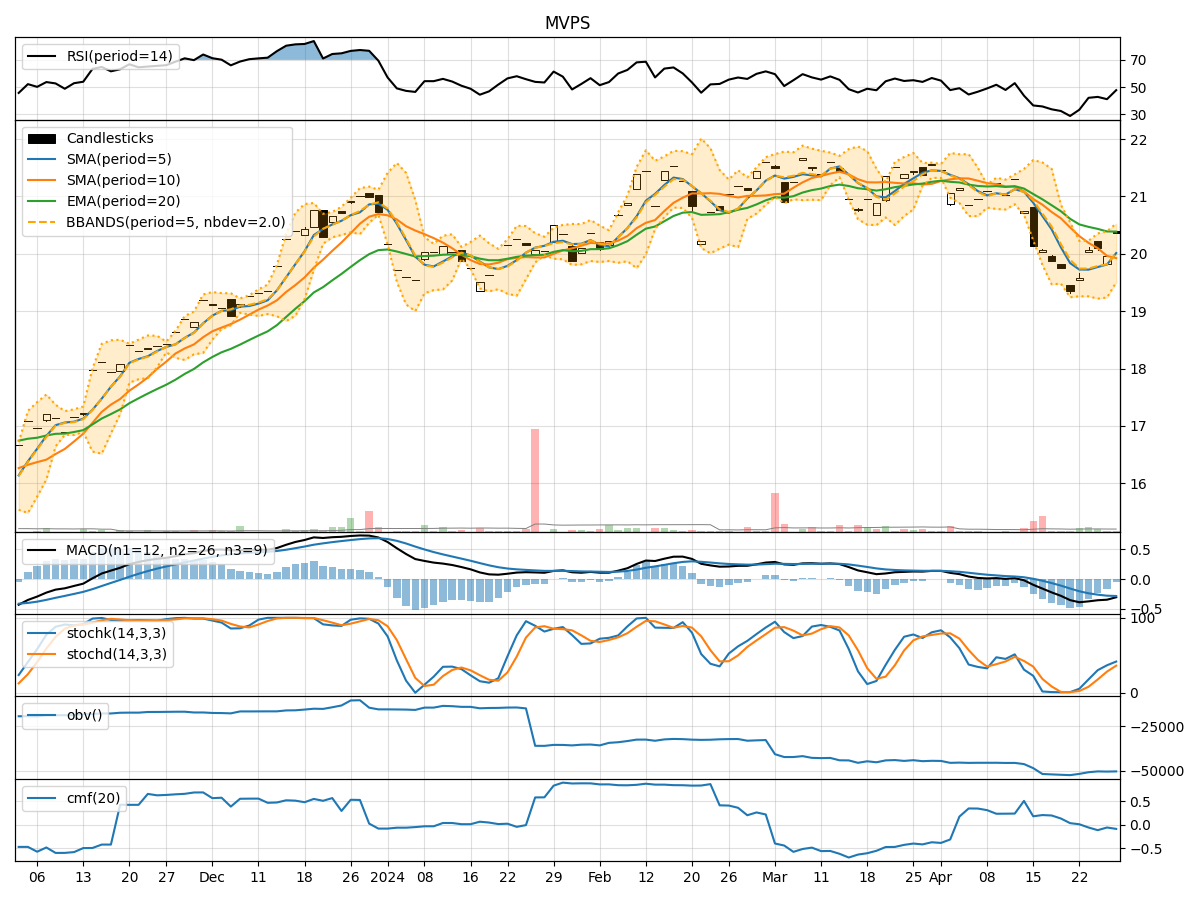
- Moving Averages (MA): The 5-day MA has been relatively stable around $20.50, indicating a short-term support level.
- MACD: The MACD line has been consistently below the signal line, suggesting a bearish trend.
- EMA: The EMA has been slightly declining, reflecting a weakening trend.
Key Observation: The stock is currently in a downtrend based on the MACD and EMA indicators.
Momentum Indicators:
- RSI: The RSI has been gradually decreasing, indicating weakening momentum.
- Stochastic Oscillator: Both %K and %D have been declining, signaling a bearish momentum.
- Williams %R: The indicator has been moving lower into oversold territory, suggesting a potential reversal.
Key Observation: Momentum is bearish, with indicators pointing towards a possible reversal from oversold levels.
Volatility Indicators:
- Bollinger Bands (BB): The stock price has been trading within the lower Bollinger Band, indicating oversold conditions.
- Bollinger Band Width: The band width has been narrowing, suggesting decreasing volatility.
Key Observation: The stock is currently oversold and experiencing reduced volatility.
Volume Indicators:
- On-Balance Volume (OBV): The OBV has been consistently negative, indicating selling pressure.
- Chaikin Money Flow (CMF): The CMF has been negative, reflecting a lack of buying interest.
Key Observation: Volume indicators suggest a bearish sentiment with selling pressure dominating.
Conclusion:
Based on the analysis of the technical indicators, the stock is currently in a downtrend with bearish momentum and oversold conditions. The volatility is low, indicating a possible consolidation phase. The volume indicators confirm the bearish sentiment with selling pressure prevailing.
Forecast:
Considering the current technical outlook, the next few days are likely to see the stock price continue its downward movement before potentially stabilizing or experiencing a minor rebound. Traders should exercise caution and consider waiting for signs of a reversal before considering long positions.
Disclaimer:
This analysis is based solely on technical indicators and historical data, and actual market movements may vary. It is essential to conduct thorough research and consider other factors before making investment decisions. Consulting with a financial advisor is recommended for personalized guidance tailored to individual investment goals and risk tolerance levels.