Technical Analysis of MVV 2024-05-10
Overview:
In analyzing the technical indicators for MVV over the last 5 days, we will delve into the trend, momentum, volatility, and volume indicators to provide a comprehensive outlook on the possible stock price movement in the coming days. By examining these key aspects, we aim to offer valuable insights and predictions for informed decision-making.
Trend Analysis:
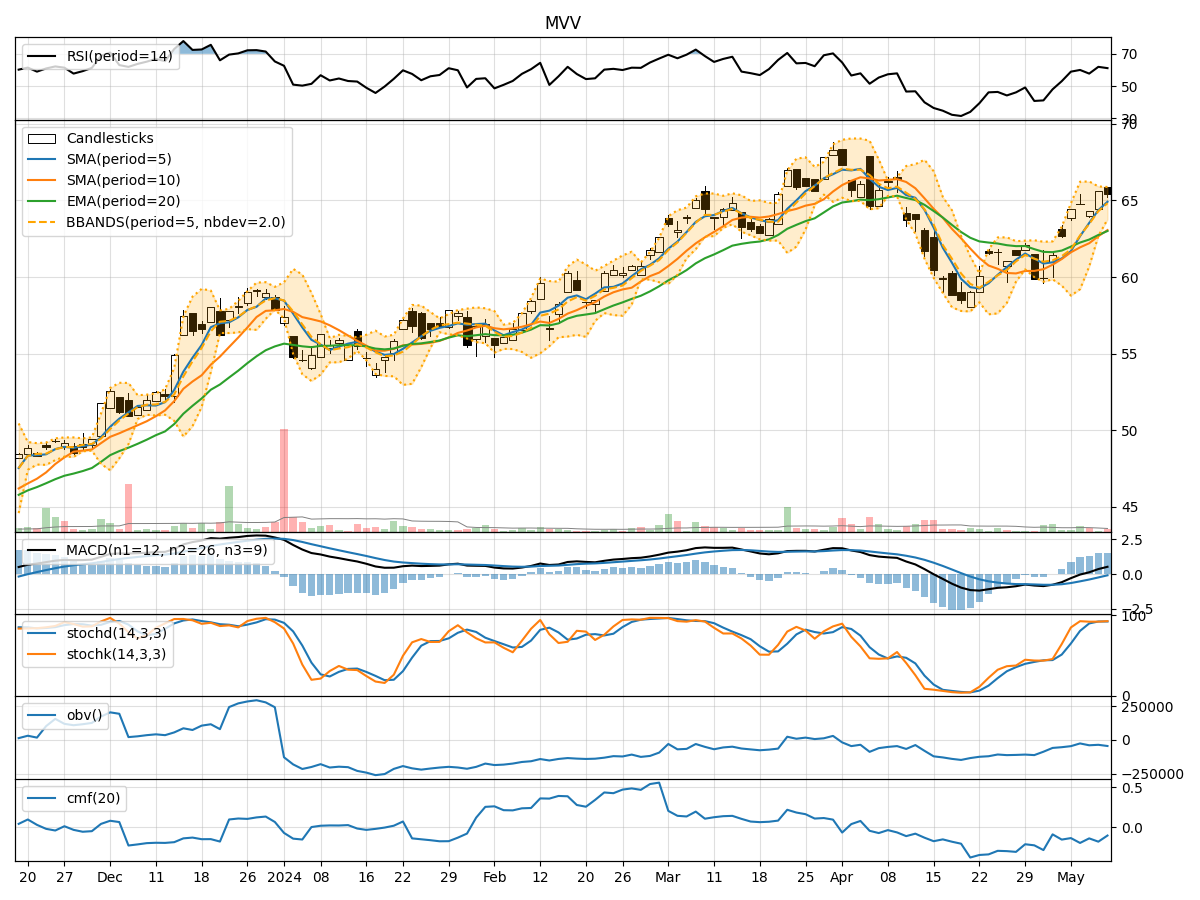
- Moving Averages (MA): The 5-day MA has been consistently above the closing prices, indicating a bullish trend.
- MACD: The MACD line has been above the signal line, suggesting a bullish momentum.
- Relative Strength Index (RSI): RSI values have been fluctuating but generally above 50, indicating bullish momentum.
Key Observation: The trend indicators point towards a bullish sentiment in the stock price movement.
Momentum Analysis:
- Stochastic Oscillator: Both %K and %D values have been consistently high, indicating strong buying momentum.
- Williams %R (WillR): The values have been mostly negative, suggesting an oversold condition.
Key Observation: Momentum indicators reflect a strong buying sentiment and potential for a price increase.
Volatility Analysis:
- Bollinger Bands (BB): The bands have been narrowing, indicating decreasing volatility.
Key Observation: Volatility has been decreasing, potentially leading to a period of consolidation or a breakout.
Volume Analysis:
- On-Balance Volume (OBV): The OBV has been fluctuating but not showing a clear trend.
- Chaikin Money Flow (CMF): CMF values have been negative, indicating selling pressure.
Key Observation: Volume indicators suggest mixed signals with no clear direction in volume flow.
Conclusion:
Based on the analysis of trend, momentum, volatility, and volume indicators, the next few days' possible stock price movement for MVV is likely to be upward. The bullish trend and momentum indicators, coupled with decreasing volatility, indicate a potential for a price increase. However, the mixed signals in volume indicators suggest caution and the need for monitoring volume movements closely.
Recommendation:
- Consider entering a long position based on the bullish trend and momentum signals.
- Monitor volume movements for confirmation of the price trend.
- Set stop-loss levels to manage risk in case of unexpected price reversals.
By combining technical analysis with market dynamics, this assessment provides a well-rounded view of the potential stock price movement for MVV in the coming days.