Technical Analysis of MXI 2024-05-10
Overview:
In analyzing the technical indicators for MXI over the last 5 days, we will delve into the trend, momentum, volatility, and volume indicators to provide a comprehensive outlook on the possible stock price movement in the coming days. By examining these key aspects, we aim to offer valuable insights and predictions to guide your investment decisions.
Trend Indicators:
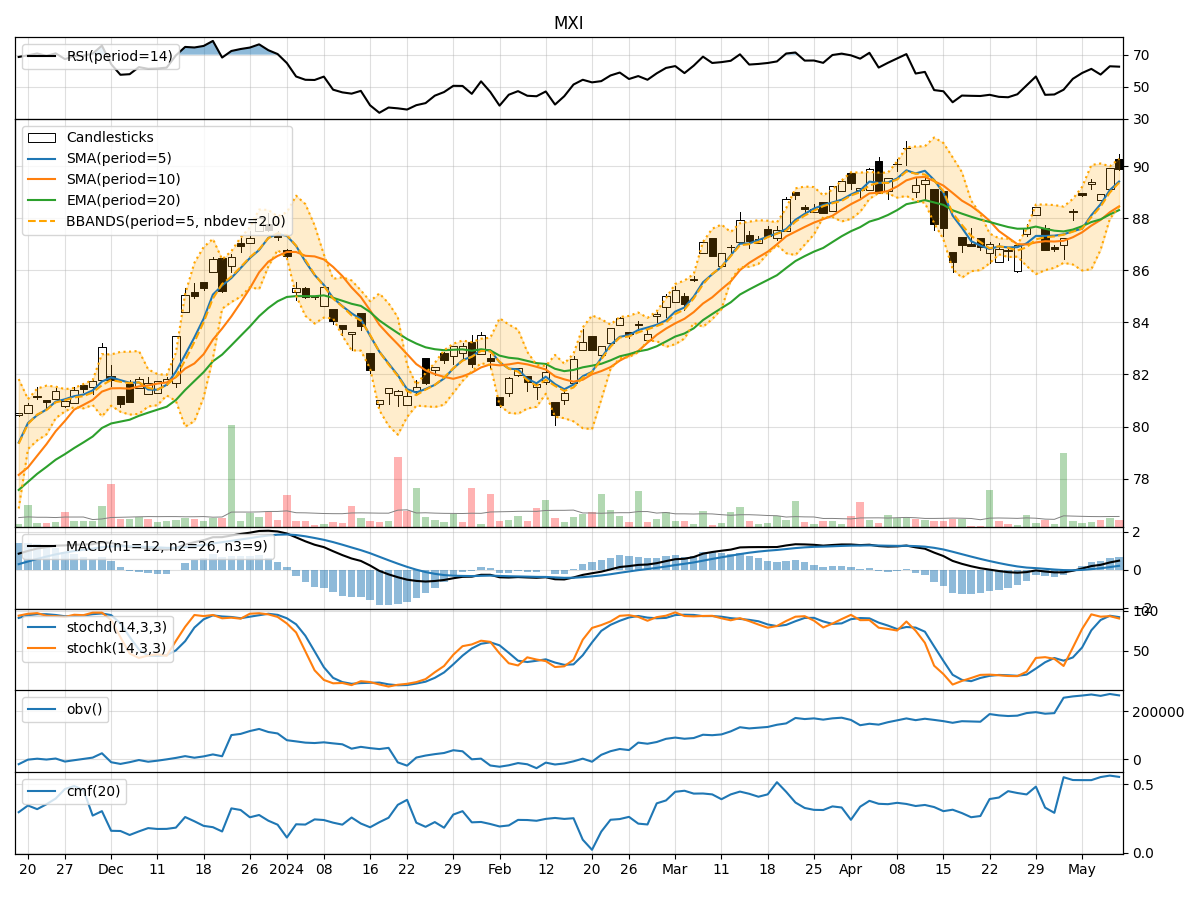
- Moving Averages (MA): The 5-day moving average has been consistently above the longer-term moving averages (SMA and EMA), indicating a short-term uptrend.
- MACD: The MACD line has been above the signal line for the past 5 days, suggesting bullish momentum.
- MACD Histogram: The histogram has been increasing, indicating strengthening bullish momentum.
Momentum Indicators:
- RSI: The RSI has been fluctuating around the 60-70 range, indicating a neutral to slightly bullish momentum.
- Stochastic Oscillator: Both %K and %D have been in the overbought territory, suggesting a potential reversal or consolidation.
- Williams %R: The indicator has been hovering around oversold levels, signaling a possible buying opportunity.
Volatility Indicators:
- Bollinger Bands: The price has been trading within the bands, indicating normal volatility.
- Bollinger %B: The %B indicator has been fluctuating around the midline, suggesting a balanced market sentiment.
Volume Indicators:
- On-Balance Volume (OBV): The OBV has been relatively stable, indicating consistent buying pressure.
- Chaikin Money Flow (CMF): The CMF has been positive, reflecting strong buying interest over the past 20 days.
Key Observations:
- The trend indicators suggest a bullish bias in the short term.
- Momentum indicators show a mixed signal with potential for a reversal or consolidation.
- Volatility remains stable, indicating no significant price fluctuations.
- Volume indicators point towards consistent buying pressure in the stock.
Conclusion:
Based on the analysis of the technical indicators, the next few days for MXI are likely to see continued upward movement in the stock price. The trend indicators support a bullish outlook, while volume indicators indicate sustained buying interest. However, caution is advised as momentum indicators suggest a potential reversal or consolidation in the near term. Overall, the stock is poised for further upside potential in the coming days.