Technical Analysis of MYLD 2024-05-10
Overview:
In analyzing the technical indicators for MYLD over the last 5 days, we will delve into the trend, momentum, volatility, and volume indicators to provide a comprehensive outlook on the possible stock price movement. By examining key metrics such as moving averages, MACD, RSI, Bollinger Bands, and OBV, we aim to offer valuable insights and predictions for the upcoming trading days.
Trend Indicators:
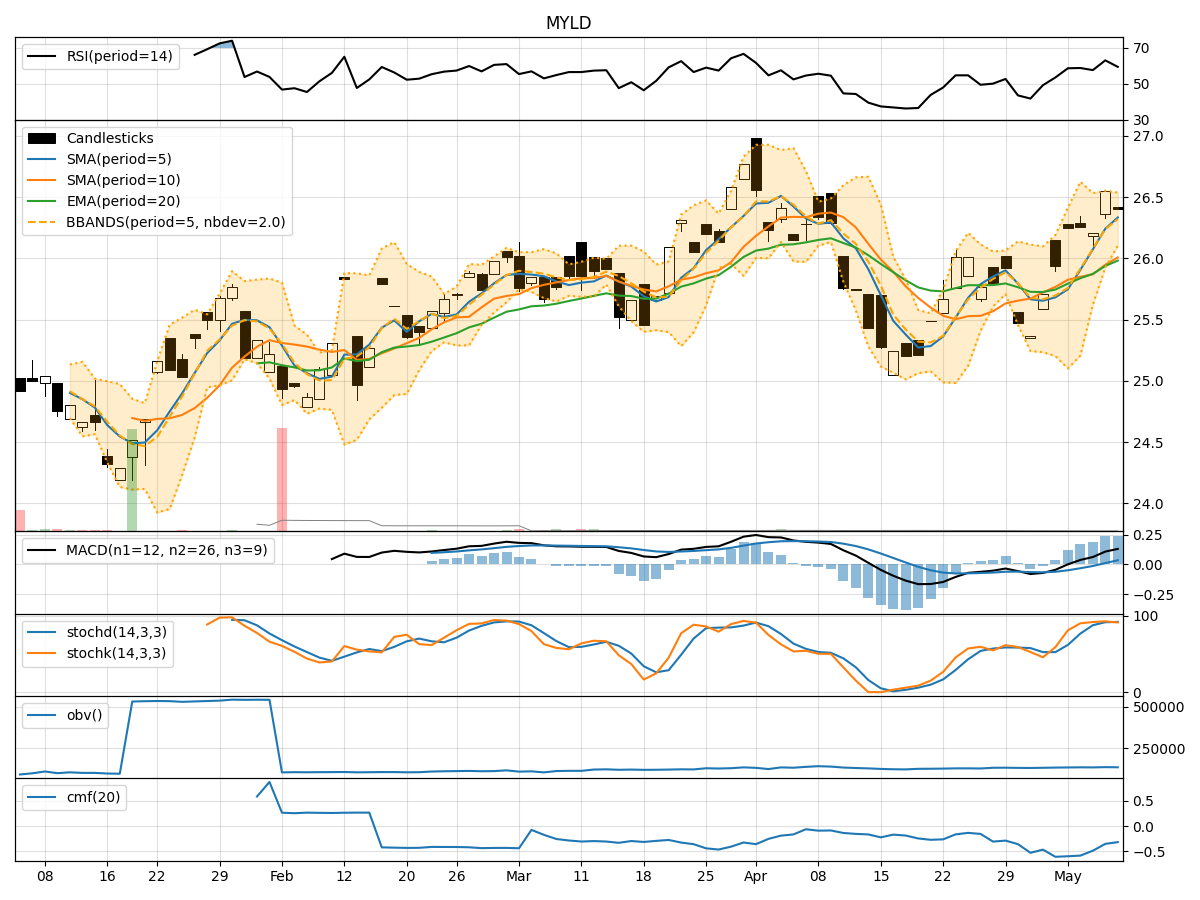
- Moving Averages (MA): The 5-day moving average has been consistently above the 10-day simple moving average, indicating a short-term bullish trend.
- MACD: The MACD line has been consistently above the signal line, suggesting positive momentum in the stock price.
- EMA: The exponential moving average has been trending upwards, reflecting a bullish sentiment in the market.
Momentum Indicators:
- RSI: The Relative Strength Index has been fluctuating around the neutral zone, indicating a balanced momentum between buying and selling pressure.
- Stochastic Oscillator: Both %K and %D have been hovering in the overbought territory, suggesting a potential reversal or consolidation phase.
- Williams %R: The Williams %R is showing oversold conditions, signaling a possible buying opportunity.
Volatility Indicators:
- Bollinger Bands: The stock price has been trading within the Bollinger Bands, with the bands narrowing, indicating reduced volatility and a potential breakout in either direction.
- Bollinger %B: The %B indicator is currently below 1, suggesting the stock is trading near the lower band, potentially indicating an oversold condition.
Volume Indicators:
- On-Balance Volume (OBV): The OBV has been fluctuating, indicating mixed sentiment among investors regarding the stock.
- Chaikin Money Flow (CMF): The CMF has been negative, suggesting that money may be flowing out of the stock.
Key Observations:
- The trend indicators point towards a bullish sentiment in the short term.
- Momentum indicators show a mixed picture with potential signs of overbought conditions.
- Volatility indicators suggest a period of consolidation with a potential breakout on the horizon.
- Volume indicators reflect uncertainty and a lack of strong buying or selling pressure.
Conclusion:
Based on the analysis of the technical indicators, the next few days' possible stock price movement for MYLD is likely to experience a period of consolidation. The stock may trade within a narrow range as investors assess the current market conditions. Caution is advised due to the mixed signals from the momentum and volume indicators. Traders should closely monitor key support and resistance levels for potential entry or exit points.