Technical Analysis of NACP 2024-05-10
Overview:
In analyzing the technical indicators for NACP over the last 5 days, we will delve into the trend, momentum, volatility, and volume indicators to provide a comprehensive outlook on the possible stock price movement in the coming days. By examining these key aspects, we aim to offer valuable insights and predictions to guide your investment decisions.
Trend Indicators:
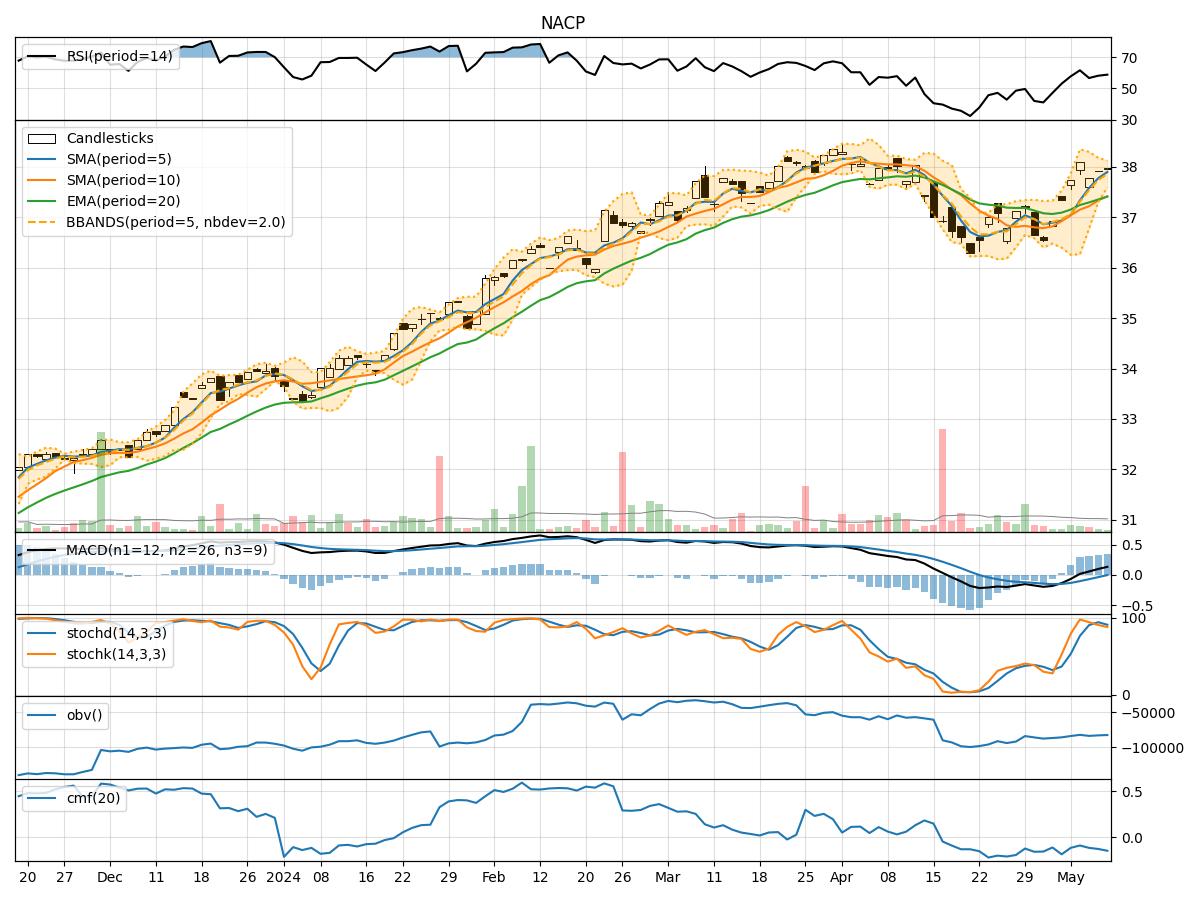
- Moving Averages (MA): The 5-day moving average has been consistently above the simple moving average (SMA) and exponential moving average (EMA), indicating a short-term uptrend.
- MACD: The MACD line has been positive and increasing, while the MACD histogram has been rising, suggesting bullish momentum.
- Conclusion: The trend indicators point towards an upward trend in the stock price.
Momentum Indicators:
- RSI: The Relative Strength Index (RSI) has been fluctuating around the 50 level, indicating neutral momentum.
- Stochastic Oscillator: Both %K and %D have been in the overbought zone, signaling potential for a reversal.
- Conclusion: The momentum indicators suggest a neutral to slightly bearish momentum in the stock.
Volatility Indicators:
- Bollinger Bands (BB): The stock price has been trading within the bands, with the %B indicator hovering around 0.6, indicating moderate volatility.
- Conclusion: Volatility is stable with no significant spikes or drops observed.
Volume Indicators:
- On-Balance Volume (OBV): The OBV has been fluctuating, indicating indecision among investors.
- Chaikin Money Flow (CMF): The CMF has been negative, suggesting outflow of money from the stock.
- Conclusion: Volume indicators reflect mixed sentiment with no clear direction.
Conclusion:
Based on the analysis of the technical indicators, the stock is likely to experience sideways movement in the coming days. While the trend indicators point towards an upward trajectory, the momentum indicators suggest a neutral to slightly bearish sentiment. Volatility remains stable, but volume indicators indicate mixed investor sentiment. Therefore, it is recommended to closely monitor the stock for any potential shifts in market dynamics before making investment decisions.
Recommendation:
- Short-Term: Consider a wait-and-see approach due to mixed signals from the indicators.
- Long-Term: Monitor for clearer trends to emerge before making significant investment decisions.
By combining insights from trend, momentum, volatility, and volume indicators, investors can make more informed decisions and adapt their strategies to the evolving market conditions. Remember to stay vigilant and adjust your positions based on real-time market developments.