Technical Analysis of NAPR 2024-05-10
Overview:
In analyzing the technical indicators for NAPR stock over the last 5 days, we will delve into the trend, momentum, volatility, and volume indicators to provide a comprehensive outlook on the possible stock price movement in the coming days. By examining these key indicators, we aim to offer valuable insights and make informed predictions regarding the future direction of NAPR stock.
Trend Analysis:
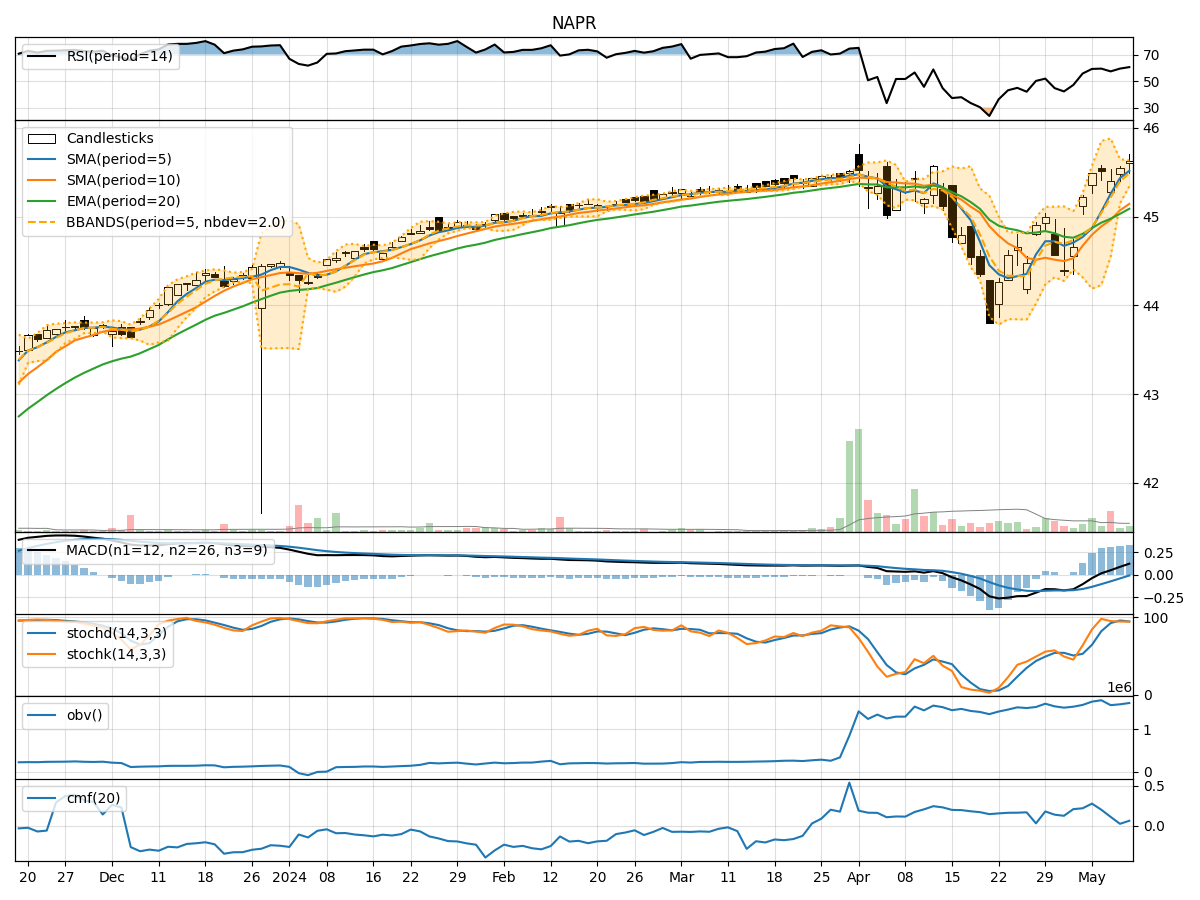
- Moving Averages (MA): The 5-day Moving Average (MA) has been consistently trending above the Simple Moving Average (SMA) and Exponential Moving Average (EMA), indicating a bullish trend.
- MACD: The MACD line has been consistently above the signal line, with both lines showing an upward trend, suggesting bullish momentum.
- MACD Histogram: The MACD Histogram has been increasing over the past 5 days, indicating strengthening bullish momentum.
Momentum Analysis:
- RSI: The Relative Strength Index (RSI) has been in the overbought territory, suggesting a strong bullish momentum.
- Stochastic Oscillator: Both %K and %D lines of the Stochastic Oscillator have been in the overbought zone, indicating a potential reversal or consolidation.
- Williams %R: The Williams %R has been fluctuating around the oversold territory, signaling potential buying opportunities.
Volatility Analysis:
- Bollinger Bands (BB): The stock price has been trading within the Bollinger Bands, with the bands narrowing, indicating decreasing volatility.
- Bollinger %B: The %B indicator has been hovering around 0.8, suggesting the stock is trading near the upper band.
Volume Analysis:
- On-Balance Volume (OBV): The OBV indicator has been relatively stable over the past 5 days, indicating consistent buying pressure.
- Chaikin Money Flow (CMF): The CMF has been positive but decreasing, suggesting a potential decrease in buying pressure.
Conclusion:
Based on the analysis of the technical indicators, the overall outlook for NAPR stock in the next few days is bullish. The trend indicators, momentum indicators, and volume indicators all point towards a continuation of the current bullish trend. However, caution is advised as the Stochastic Oscillator signals potential overbought conditions and a possible reversal or consolidation. Traders and investors should closely monitor the price action and key support/resistance levels to make informed decisions.
In summary, the next few days for NAPR stock are likely to see upward movement with the potential for some consolidation or a minor pullback before resuming the bullish trend. It is essential to combine technical analysis with risk management strategies to navigate potential market fluctuations successfully.