Technical Analysis of NBCC 2024-05-10
Overview:
In analyzing the technical indicators for NBCC over the last 5 days, we will delve into the trend, momentum, volatility, and volume indicators to provide a comprehensive outlook on the possible stock price movement in the coming days.
Trend Analysis:
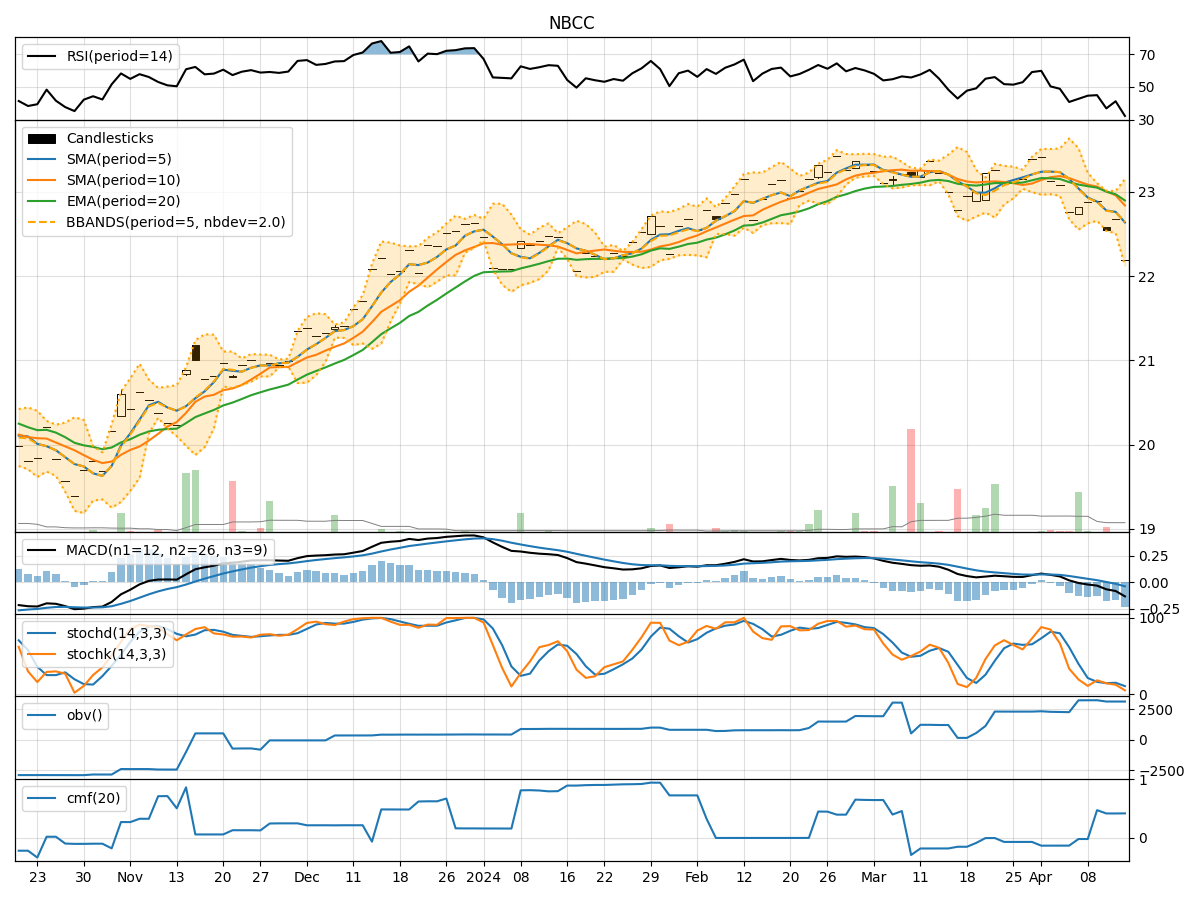
- Moving Averages (MA): The 5-day Moving Average (MA) has been consistently above the Simple Moving Average (SMA) and Exponential Moving Average (EMA), indicating a short-term bullish trend.
- MACD: The MACD line has been below the signal line, suggesting a bearish trend. However, the MACD Histogram has been showing signs of convergence, hinting at a potential trend reversal.
Momentum Analysis:
- RSI: The Relative Strength Index (RSI) has been fluctuating around the 50 level, indicating a neutral momentum.
- Stochastic Oscillator: The Stochastic Oscillator has been hovering in the overbought territory, suggesting a potential reversal or consolidation phase.
- Williams %R: The Williams %R has been oscillating near the oversold region, signaling a possible buying opportunity.
Volatility Analysis:
- Bollinger Bands: The Bollinger Bands have been relatively narrow, indicating low volatility in the stock price.
Volume Analysis:
- On-Balance Volume (OBV): The OBV has been fluctuating, suggesting mixed sentiment among investors.
- Chaikin Money Flow (CMF): The CMF has been positive, indicating buying pressure in the stock.
Key Observations:
- The trend indicators show a conflicting picture with the moving averages signaling a bullish trend while the MACD suggests a bearish bias.
- Momentum indicators indicate a neutral stance with potential for a reversal in the Stochastic Oscillator and Williams %R.
- Volatility remains low based on the Bollinger Bands, indicating a lack of significant price movements.
- Volume indicators reflect mixed sentiment among investors, with OBV fluctuating and CMF showing buying pressure.
Conclusion:
Based on the analysis of the technical indicators, the stock price of NBCC is likely to experience sideways movement in the coming days. The conflicting signals from trend and momentum indicators, coupled with low volatility and mixed volume sentiment, suggest a lack of clear direction in the near term. Traders may consider staying cautious and monitoring for a clearer trend confirmation before making significant trading decisions.