Technical Analysis of NBCE 2024-05-10
Overview:
In analyzing the technical indicators for NBCE stock over the last 5 days, we will delve into the trends, momentum, volatility, and volume indicators to provide a comprehensive outlook on the possible stock price movement in the coming days. By examining these key aspects, we aim to offer valuable insights and predictions for potential investors.
Trend Indicators:
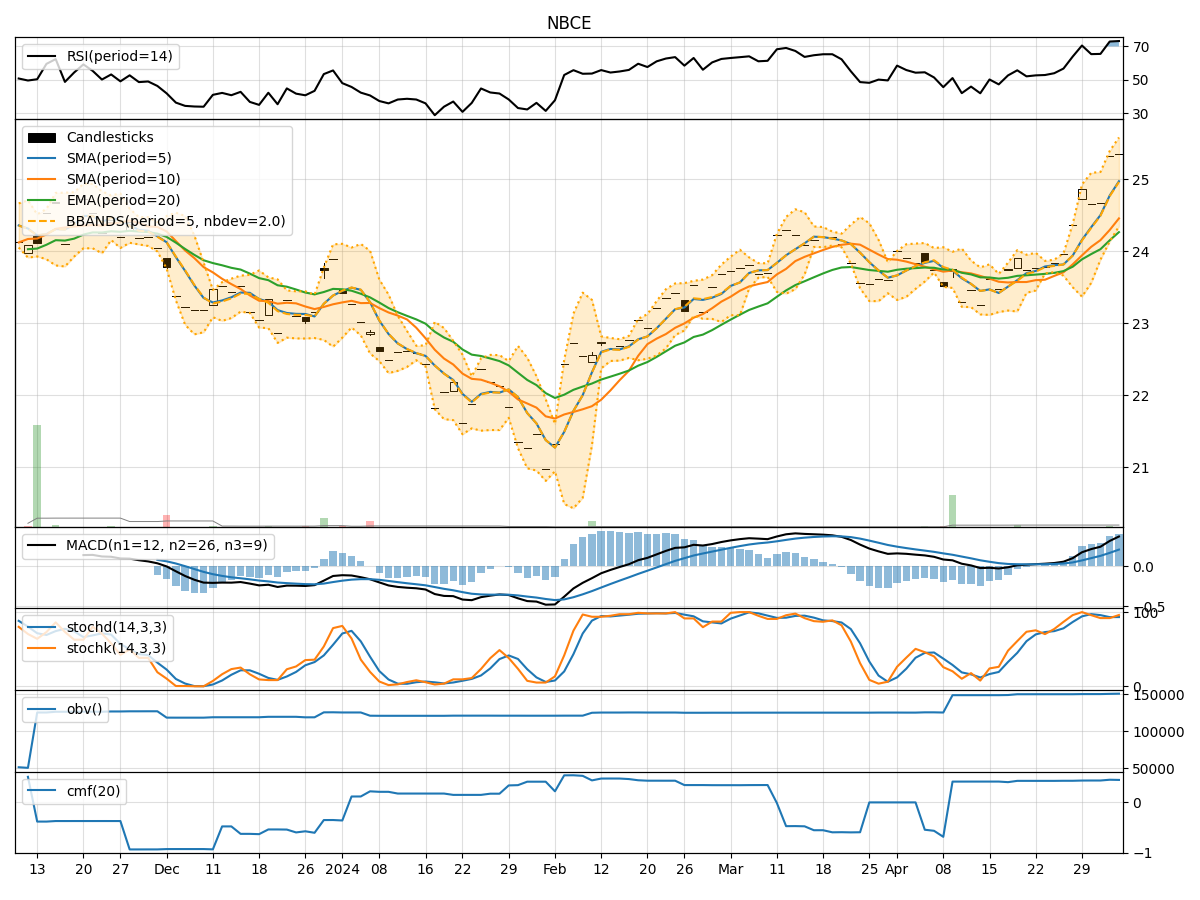
- Moving Averages (MA): The 5-day Moving Average (MA) has been consistently above the Simple Moving Average (SMA) and Exponential Moving Average (EMA), indicating a bullish trend.
- MACD: The MACD line has been above the signal line, with both lines showing an upward trend, suggesting positive momentum in the stock price.
- MACD Histogram: The MACD Histogram has been increasing over the past 5 days, indicating strengthening bullish momentum.
Momentum Indicators:
- RSI: The Relative Strength Index (RSI) has been fluctuating but generally staying within the neutral to overbought range, suggesting a balanced momentum.
- Stochastic Oscillator: Both %K and %D lines of the Stochastic Oscillator have been gradually decreasing but still in the overbought territory, indicating a potential reversal.
- Williams %R: The Williams %R has been oscillating around the oversold region, signaling a possible buying opportunity.
Volatility Indicators:
- Bollinger Bands: The Bollinger Bands have been relatively narrow, indicating low volatility in the stock price.
- Bollinger %B: The %B indicator has been hovering around the middle range, suggesting a neutral stance in terms of volatility.
Volume Indicators:
- On-Balance Volume (OBV): The OBV has been relatively stable, indicating a balance between buying and selling pressure.
- Chaikin Money Flow (CMF): The CMF has been positive but flat, suggesting a neutral sentiment regarding the flow of money into the stock.
Key Observations and Opinions:
- Trend: The stock is currently in an upward trend based on moving averages and MACD analysis.
- Momentum: Momentum indicators show a mixed signal with potential for a reversal in the short term.
- Volatility: Volatility is low, indicating a stable price movement.
- Volume: Volume indicators suggest a balanced market sentiment with no clear dominance of buyers or sellers.
Conclusion:
Based on the analysis of the technical indicators, the next few days for NBCE stock are likely to see continued upward movement with a possibility of short-term consolidation due to mixed momentum signals. Investors may consider maintaining a bullish outlook but remain cautious of potential reversals indicated by the Stochastic Oscillator. It is advisable to monitor the price action closely for any signs of a trend reversal.