Technical Analysis of NBCT 2024-05-10
Overview:
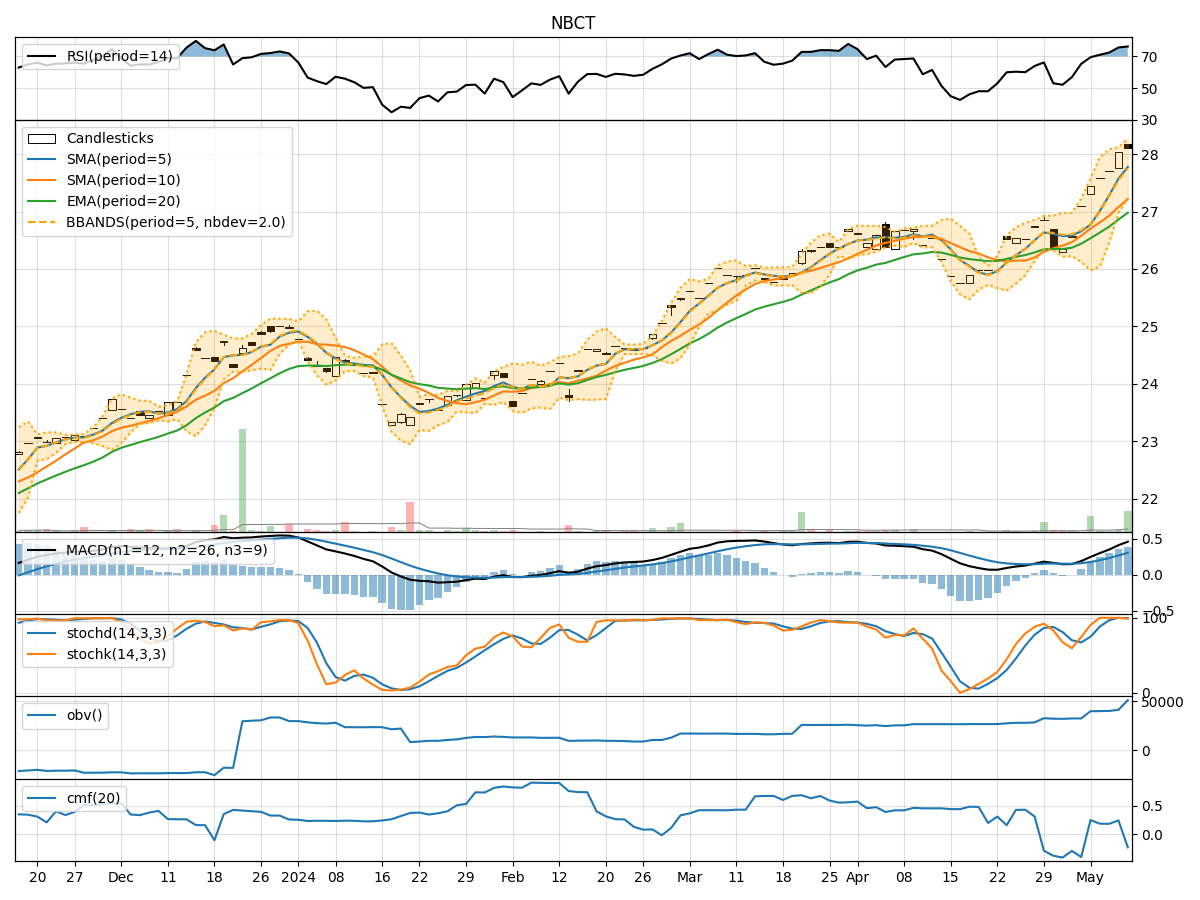
In analyzing the technical indicators for NBCT over the last 5 days, we will delve into the trend, momentum, volatility, and volume indicators to provide a comprehensive outlook on the possible stock price movement in the coming days. By examining these key indicators, we aim to offer valuable insights and predictions for potential investors.
Trend Indicators:
- Moving Averages (MA): The 5-day MA has been consistently above the closing prices, indicating an upward trend.
- MACD: The MACD line has been steadily increasing, with the MACD histogram also showing positive values, suggesting bullish momentum.
- EMA: The exponential moving average has been trending upwards, supporting the bullish sentiment.
Momentum Indicators:
- RSI: The RSI has been in the overbought territory, indicating strong buying momentum.
- Stochastic Oscillator: Both %K and %D have been at or near 100, signaling strong upward momentum.
- Williams %R: The indicator has been in the oversold region, suggesting a potential reversal.
Volatility Indicators:
- Bollinger Bands: The stock price has been consistently trading above the middle Bollinger Band, indicating an uptrend.
- Bollinger %B: The %B value has been above 0.5, suggesting bullish momentum.
- Bollinger Band Width: The band width has been narrowing, indicating decreasing volatility.
Volume Indicators:
- On-Balance Volume (OBV): The OBV has been steadily increasing, reflecting strong buying pressure.
- Chaikin Money Flow (CMF): The CMF has been positive, indicating accumulation by investors.
Key Observations and Opinions:
- Trend: The stock is in a strong upward trend supported by moving averages and MACD.
- Momentum: Momentum indicators suggest strong buying pressure and potential for further upside.
- Volatility: Bollinger Bands indicate an uptrend with decreasing volatility, signaling a possible consolidation phase.
- Volume: Increasing OBV and positive CMF point towards bullish sentiment and investor accumulation.
Conclusion:
Based on the analysis of the technical indicators, the next few days for NBCT are likely to see continued upward movement in the stock price. The bullish trend, strong momentum, and positive volume indicators all point towards a potential further increase in the stock price. Investors may consider buying or holding positions in NBCT for potential gains in the coming days.