Technical Analysis of NBGR 2024-05-10
Overview:
In analyzing the technical indicators for NBGR over the last 5 days, we will delve into the trend, momentum, volatility, and volume indicators to provide a comprehensive assessment of the stock's potential price movement. By examining these key factors, we aim to offer valuable insights and predictions for the next few days.
Trend Indicators:
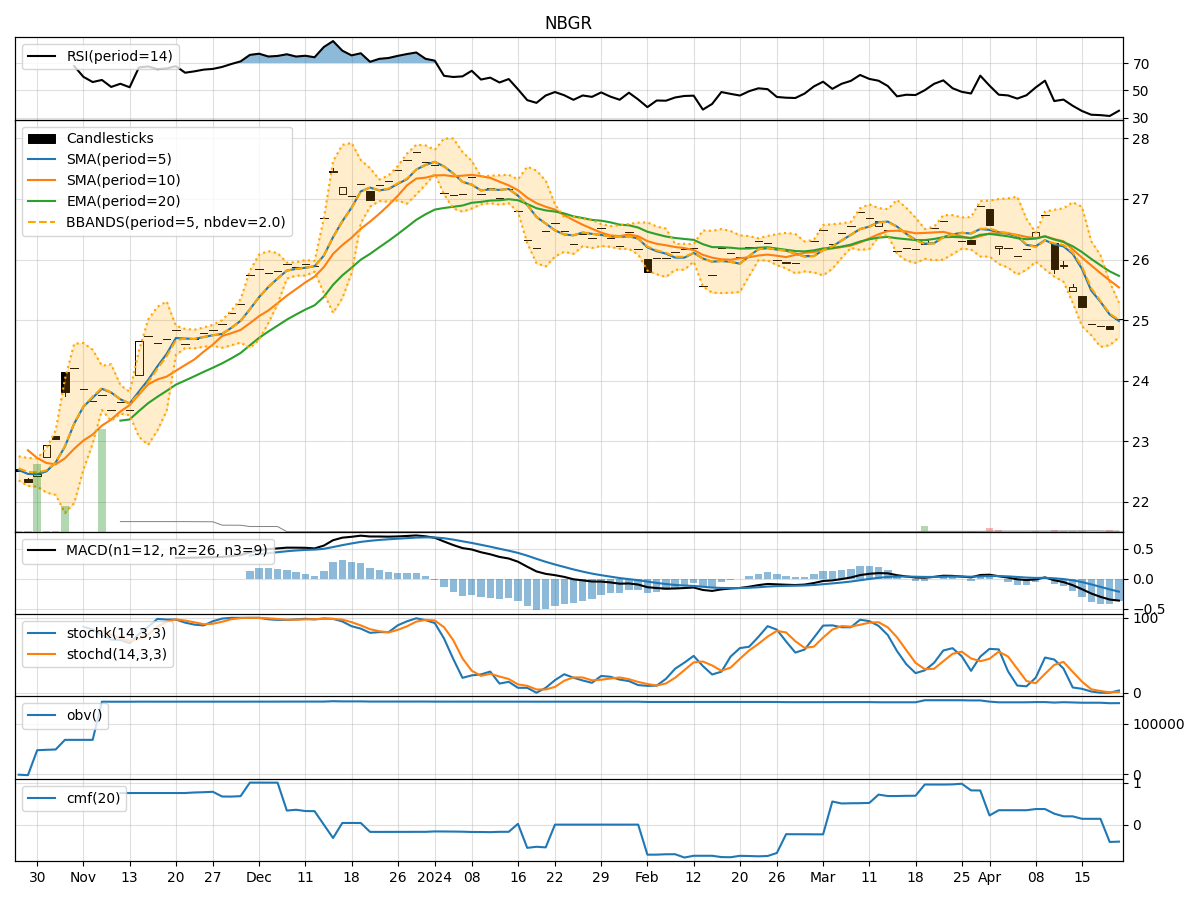
- Moving Averages (MA): The 5-day Moving Average (MA) has been consistently above the Simple Moving Average (SMA) and Exponential Moving Average (EMA), indicating a bullish trend.
- MACD: The Moving Average Convergence Divergence (MACD) has been positive, with the MACD line consistently above the Signal line, suggesting bullish momentum.
- RSI: The Relative Strength Index (RSI) has been fluctuating around the neutral level of 50, indicating a balanced market sentiment.
Momentum Indicators:
- Stochastic Oscillator: The Stochastic Oscillator has been in the overbought territory, suggesting a potential reversal or consolidation.
- Williams %R: The Williams %R indicator has been hovering around the oversold region, signaling a possible buying opportunity.
Volatility Indicators:
- Bollinger Bands: The Bollinger Bands have shown narrowing volatility, indicating a potential decrease in price fluctuations.
- Average True Range (ATR): The ATR has been relatively stable, suggesting consistent price movements.
Volume Indicators:
- On-Balance Volume (OBV): The OBV has shown a slight increase, indicating buying pressure in the stock.
- Chaikin Money Flow (CMF): The CMF has been positive, reflecting strong buying interest.
Key Observations:
- The trend indicators suggest a bullish bias in the short term, supported by positive MACD and moving averages.
- Momentum indicators show conflicting signals with the Stochastic Oscillator in overbought territory and Williams %R nearing oversold levels.
- Volatility indicators point towards a potential decrease in price fluctuations, indicating a period of consolidation.
- Volume indicators reflect a slight increase in buying pressure, supporting the bullish outlook.
Conclusion:
Based on the analysis of the technical indicators, the next few days for NBGR are likely to see further upward movement with a potential for consolidation in the near term. Traders should monitor the Stochastic Oscillator for a possible reversal and consider the narrowing Bollinger Bands for potential breakout opportunities. Overall, the stock shows signs of strength and positive momentum, supporting a bullish view for the upcoming trading sessions.