Technical Analysis of NBOS 2024-05-10
Overview:
In analyzing the provided Technical Analysis (TA) data for NBOS stock over the last 5 days, we will delve into the trend, momentum, volatility, and volume indicators to forecast the possible stock price movement in the upcoming days. By examining these key indicators, we aim to provide a comprehensive and insightful prediction for the future direction of NBOS stock.
Trend Analysis:
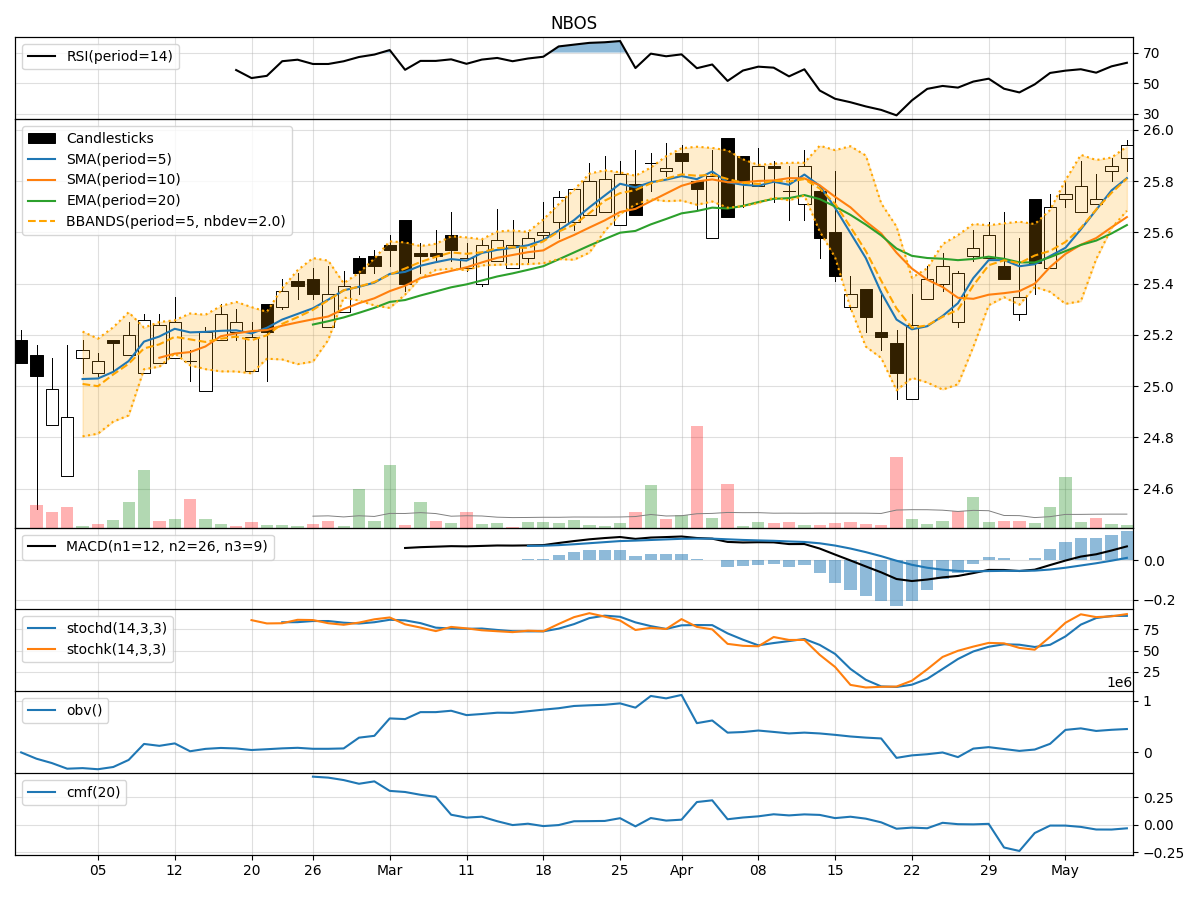
- Moving Averages (MA): The 5-day Moving Average (MA) has been consistently above the Simple Moving Average (SMA) and Exponential Moving Average (EMA) over the past 5 days, indicating a bullish trend.
- MACD: The Moving Average Convergence Divergence (MACD) has shown positive values, with the MACD line consistently above the Signal line, suggesting bullish momentum in the stock price.
Momentum Analysis:
- RSI: The Relative Strength Index (RSI) has been trending upwards and is currently in the overbought territory, indicating strong buying momentum.
- Stochastic Oscillator: Both %K and %D lines of the Stochastic Oscillator are in the overbought zone, suggesting a strong bullish sentiment in the market.
Volatility Analysis:
- Bollinger Bands (BB): The Bollinger Bands have been relatively narrow, indicating low volatility in the stock price movement.
Volume Analysis:
- On-Balance Volume (OBV): The OBV has shown a slight decrease over the past 5 days, indicating some selling pressure in the stock.
- Chaikin Money Flow (CMF): The CMF has been negative, suggesting outflow of money from the stock.
Key Observations:
- The trend indicators suggest a bullish outlook with moving averages and MACD signaling positive momentum.
- Momentum indicators like RSI and Stochastic Oscillator indicate strong buying pressure in the market.
- Volatility remains low, as indicated by the narrow Bollinger Bands.
- Volume indicators show a slight decrease in OBV and negative CMF, hinting at some selling activity.
Conclusion:
Based on the analysis of the technical indicators, the next few days for NBOS stock are likely to see a continuation of the bullish trend. The strong buying momentum, low volatility, and positive trend indicators point towards a potential upward movement in the stock price. Traders and investors may consider buying opportunities in NBOS stock based on the current technical outlook.
Disclaimer:
This analysis is based solely on technical indicators and historical data. It is important to consider other fundamental factors and market dynamics before making any investment decisions. Consulting with a financial advisor is recommended to align investment strategies with individual risk tolerance and financial goals.