Technical Analysis of NDIA 2024-05-10
Overview:
In analyzing the technical indicators for NDIA over the last 5 days, we will delve into the trend, momentum, volatility, and volume indicators to provide a comprehensive outlook on the possible stock price movement in the coming days. By examining these key aspects, we aim to offer valuable insights and predictions to guide your investment decisions.
Trend Indicators:
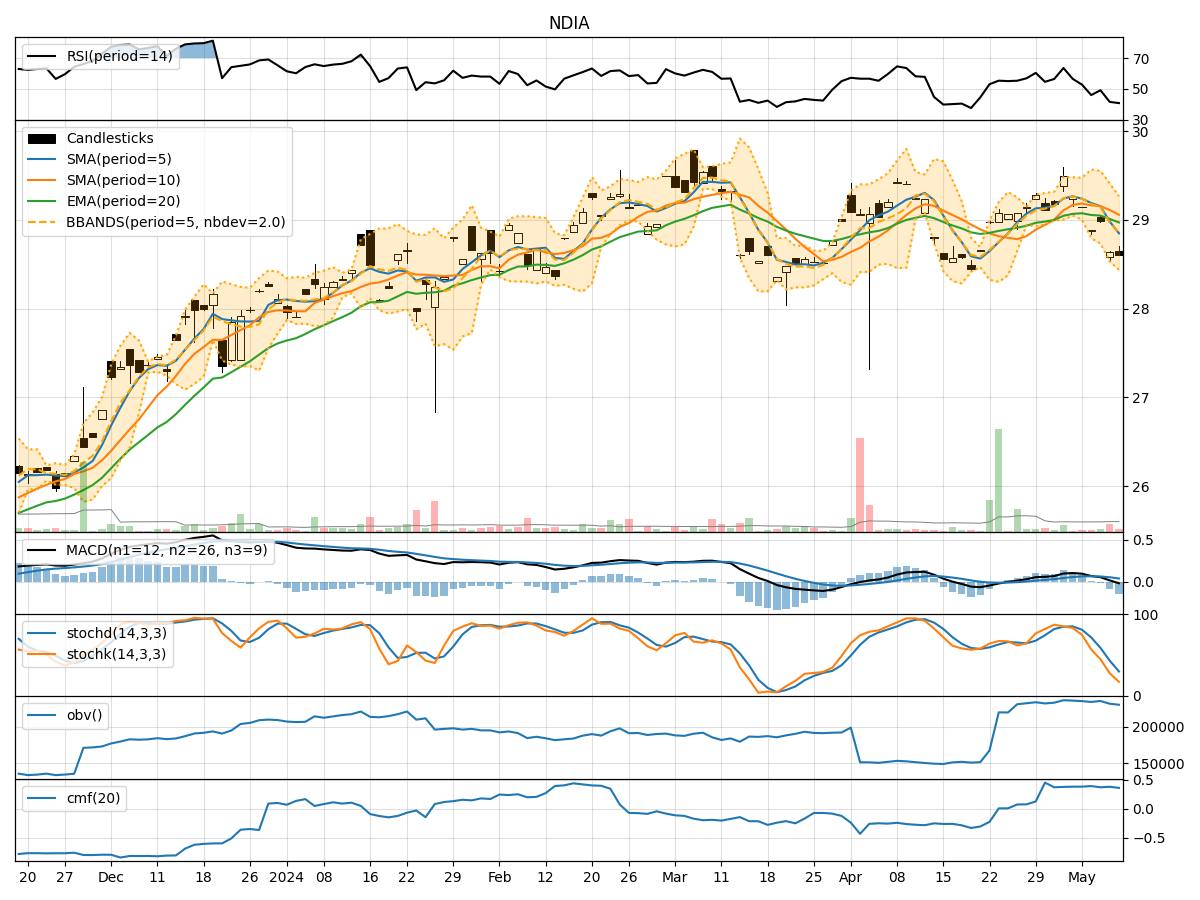
- Moving Averages (MA): The 5-day Moving Average (MA) has been consistently below the Simple Moving Average (SMA) and Exponential Moving Average (EMA), indicating a downward trend.
- MACD: The MACD line has been below the signal line, with the MACD Histogram also showing negative values, suggesting bearish momentum.
Momentum Indicators:
- RSI: The Relative Strength Index (RSI) has been fluctuating around the 50 level, indicating a lack of strong momentum in either direction.
- Stochastic Oscillator: Both %K and %D have been decreasing, reaching oversold levels, signaling potential downward pressure.
- Williams %R: The Williams %R is in oversold territory, suggesting a possible reversal or continuation of the downtrend.
Volatility Indicators:
- Bollinger Bands (BB): The stock price has been trading below the lower Bollinger Band, indicating oversold conditions and potential for a reversal.
- Bollinger Band Width (BBW): The BBW has been narrowing, suggesting decreasing volatility and a possible period of consolidation.
Volume Indicators:
- On-Balance Volume (OBV): The OBV has been declining, indicating selling pressure and potential bearish sentiment.
- Chaikin Money Flow (CMF): The CMF has been relatively stable but below 0.5, suggesting a lack of strong buying interest.
Key Observations and Opinions:
- Trend: The trend indicators point towards a downward trajectory, supported by the moving averages and MACD signals.
- Momentum: Momentum indicators reflect a bearish sentiment, with oversold conditions on the Stochastic and Williams %R.
- Volatility: Volatility indicators suggest a potential reversal as the Bollinger Bands indicate oversold conditions and narrowing BBW.
- Volume: The declining OBV and CMF below 0.5 indicate weak buying interest and potential for further downside.
Conclusion:
Based on the analysis of the technical indicators, the next few days' possible stock price movement for NDIA is likely to continue downward in the short term. The overall outlook is bearish, with potential for a reversal if there is a significant increase in buying interest and a break above key resistance levels. Traders and investors should exercise caution and consider waiting for more definitive signals before making any significant trading decisions.