Technical Analysis of NETL 2024-05-10
Overview:
In analyzing the technical indicators for NETL over the last 5 days, we will delve into the trend, momentum, volatility, and volume indicators to provide a comprehensive outlook on the possible stock price movement in the coming days. By examining these key aspects, we aim to offer valuable insights and predictions to guide investment decisions.
Trend Analysis:
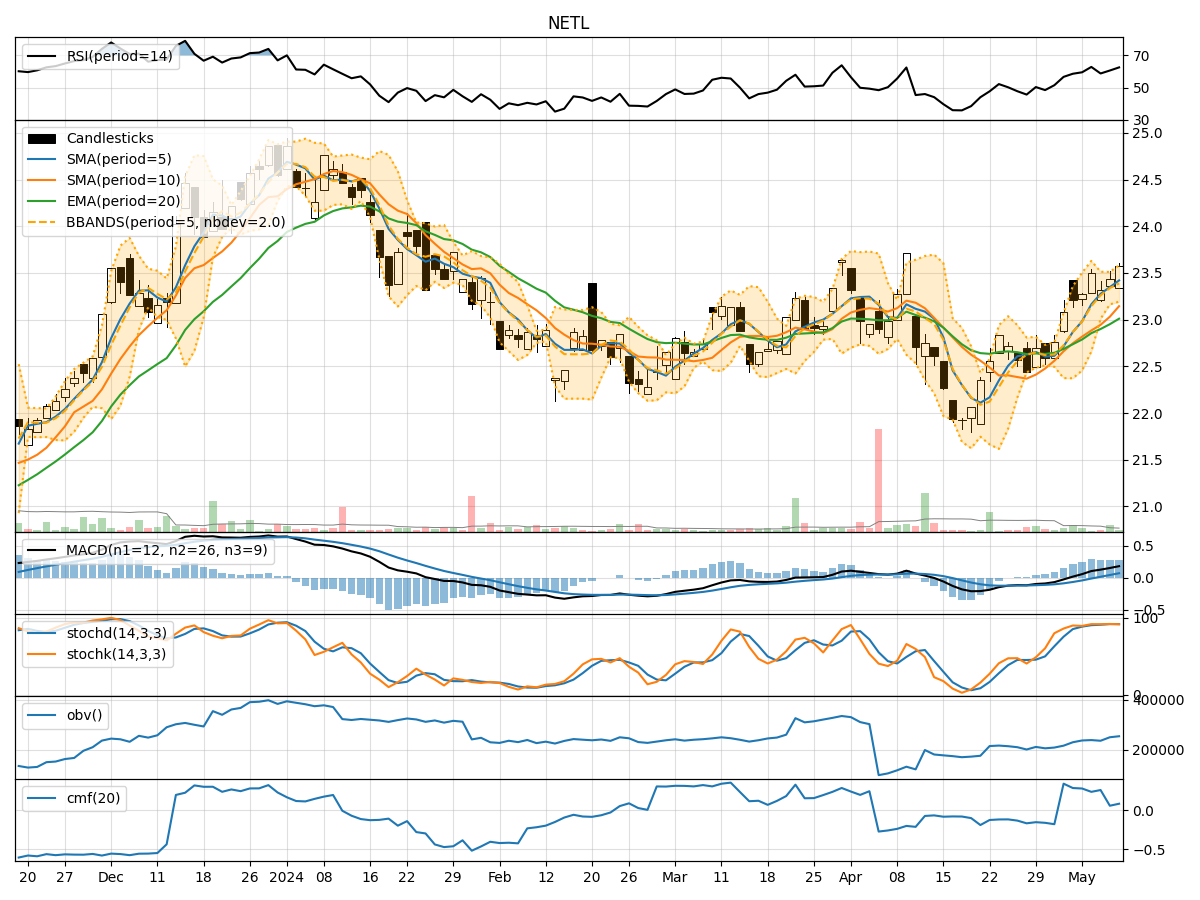
- Moving Averages (MA): The 5-day Moving Average (MA) has been consistently above the Simple Moving Average (SMA) and Exponential Moving Average (EMA), indicating a bullish trend.
- MACD: The MACD line has been consistently above the signal line, with both lines showing an upward trend, suggesting bullish momentum.
Momentum Analysis:
- RSI: The Relative Strength Index (RSI) has been fluctuating around the 60-65 range, indicating a neutral momentum.
- Stochastic Oscillator: Both %K and %D have been hovering in the overbought zone, suggesting a potential reversal or consolidation.
Volatility Analysis:
- Bollinger Bands (BB): The stock price has been trading within the upper Bollinger Band (BBU), indicating an overbought condition.
Volume Analysis:
- On-Balance Volume (OBV): The OBV has shown mixed signals, with fluctuations in volume accumulation.
- Chaikin Money Flow (CMF): The CMF has been relatively low, indicating weak buying pressure.
Key Observations:
- The trend indicators suggest a strong bullish sentiment in the short term.
- Momentum indicators show a neutral stance with a potential for a reversal.
- Volatility indicators point towards an overbought condition.
- Volume indicators reflect mixed signals with weak buying pressure.
Conclusion:
Based on the analysis of technical indicators, the next few days' possible stock price movement for NETL is likely to be sideways to slightly bearish. While the trend indicators signal a bullish outlook, the overbought condition indicated by volatility indicators and the potential reversal suggested by momentum indicators may lead to a consolidation or a minor pullback in the stock price. Traders should exercise caution and consider waiting for clearer signals before making significant trading decisions.