Technical Analysis of NETZ 2024-05-10
Overview:
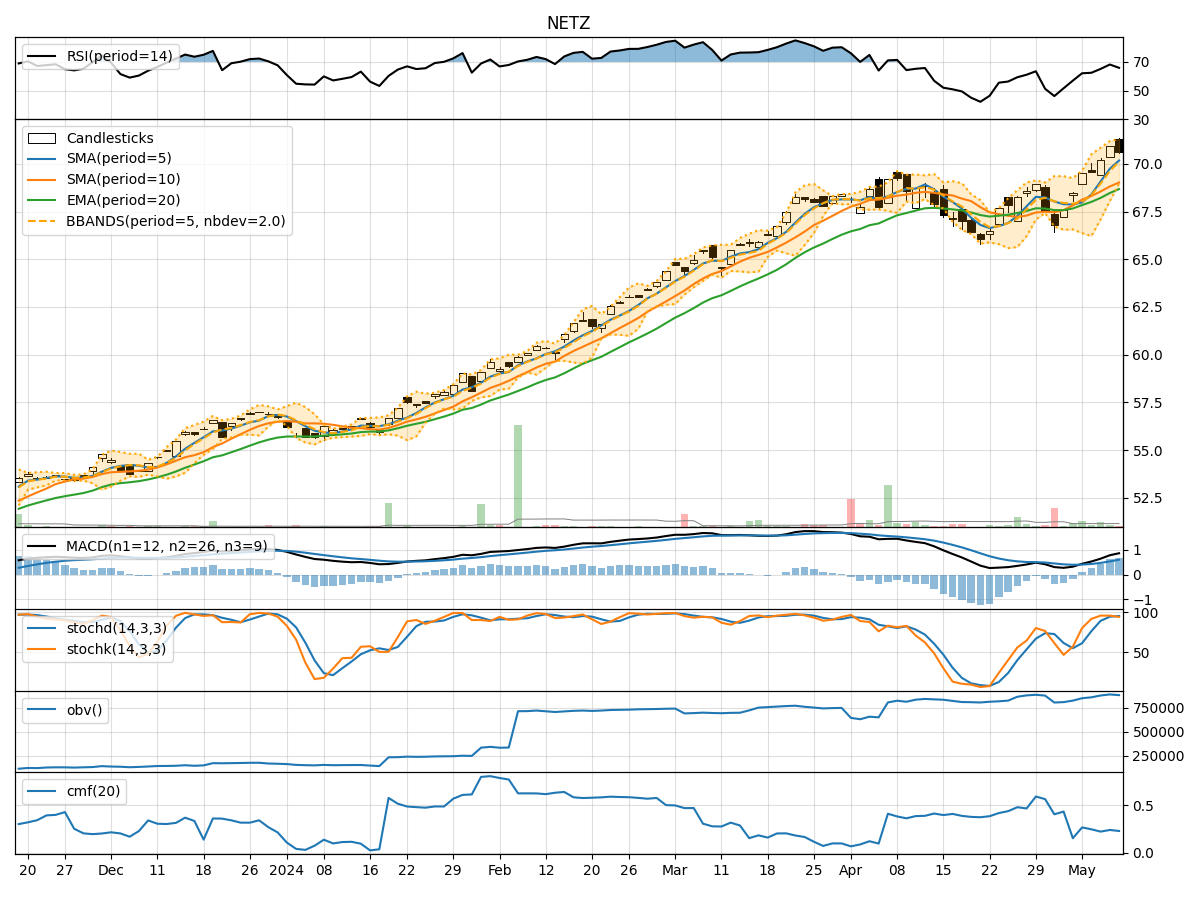
In the last 5 trading days, NETZ stock has shown a consistent uptrend in both price and volume. The moving averages have been trending upwards, indicating a bullish sentiment. Momentum indicators like RSI and Stochastic oscillators suggest the stock is in overbought territory but still showing strength. Volatility indicators show a narrowing of Bollinger Bands, indicating potential consolidation. Volume indicators like OBV and CMF show positive accumulation.
Trend Analysis:
- Moving averages (MA) have been steadily increasing, with the 5-day MA consistently above the 10-day SMA, indicating a bullish trend.
- MACD and MACD Histogram have been rising, showing increasing bullish momentum.
- Overall, the trend indicators suggest a strong bullish sentiment in the stock.
Momentum Analysis:
- RSI has been in the overbought zone, indicating a potential pullback, but it has not shown any signs of weakness yet.
- Stochastic oscillators are also in the overbought region, suggesting caution, but the stock has been resilient.
- Williams %R is in the oversold territory, indicating a potential reversal, but it needs confirmation.
- Momentum indicators suggest a cautious outlook due to overbought conditions.
Volatility Analysis:
- Bollinger Bands are narrowing, indicating decreasing volatility and a potential period of consolidation.
- The stock price has been trading within the bands, suggesting a range-bound movement.
- Volatility indicators point towards a consolidation phase in the stock.
Volume Analysis:
- On-Balance Volume (OBV) has been steadily increasing, showing positive accumulation by investors.
- Chaikin Money Flow (CMF) is positive, indicating buying pressure in the stock.
- Volume indicators suggest strong buying interest in the stock.
Conclusion:
Based on the technical analysis of trend, momentum, volatility, and volume indicators, the next few days for NETZ stock are likely to see a continuation of the bullish trend. Despite being in overbought territory, the stock has shown resilience and strong buying interest. The narrowing Bollinger Bands suggest a period of consolidation, which could lead to a potential breakout in the upward direction. Investors should consider buying on dips to capitalize on the ongoing bullish momentum.