Technical Analysis of NFLP 2024-05-10
Overview:
In analyzing the technical indicators for NFLP over the last 5 days, we will delve into the trend, momentum, volatility, and volume indicators to provide a comprehensive outlook on the possible stock price movement. By examining these key factors, we aim to offer valuable insights and predictions for the upcoming trading days.
Trend Analysis:
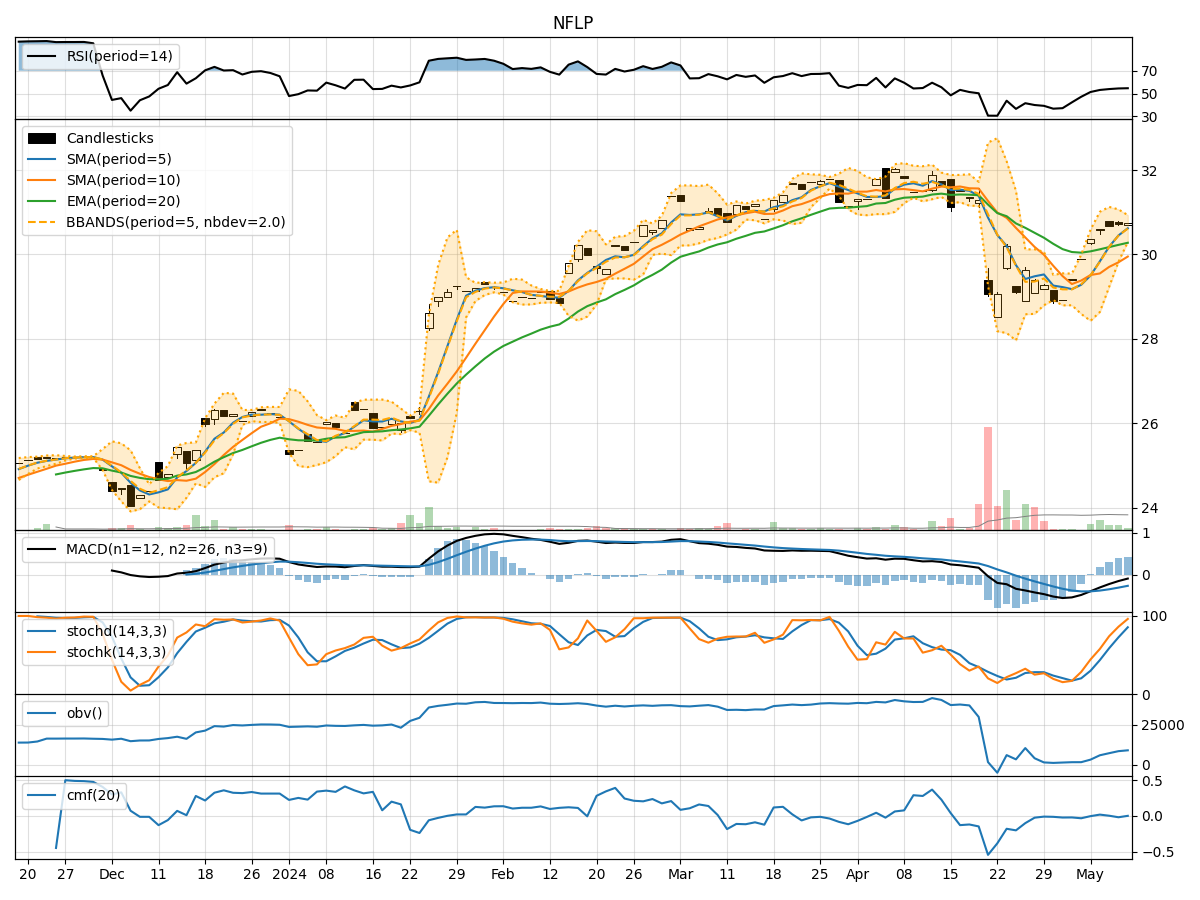
- Moving Averages (MA): The 5-day Moving Average (MA) has been consistently rising, indicating a bullish trend in the short term.
- MACD: The MACD line has been negative but showing signs of convergence towards the signal line, suggesting a potential bullish crossover.
- RSI: The Relative Strength Index (RSI) is hovering around the neutral zone, indicating a balanced market sentiment.
Momentum Analysis:
- Stochastic Oscillator: Both %K and %D levels are in the overbought territory, signaling a potential reversal or consolidation.
- Williams %R: The Williams %R is also in the overbought region, suggesting a possible pullback in the stock price.
Volatility Analysis:
- Bollinger Bands: The Bollinger Bands are narrowing, indicating decreasing volatility and a potential period of consolidation.
- Average True Range (ATR): The ATR is relatively low, further supporting the view of reduced volatility in the stock.
Volume Analysis:
- On-Balance Volume (OBV): The OBV has been fluctuating but with a slight negative trend, indicating some distribution happening in the stock.
- Chaikin Money Flow (CMF): The CMF is close to zero, suggesting a balance between buying and selling pressure.
Key Observations:
- The stock is currently in a short-term bullish trend based on moving averages.
- Momentum indicators suggest a potential reversal or consolidation due to overbought conditions.
- Volatility is decreasing, indicating a period of consolidation or sideways movement.
- Volume indicators show a slight distribution pattern, but with a balanced buying and selling pressure.
Conclusion:
Based on the analysis of the technical indicators, the next few days for NFLP could see sideways movement or a slight pullback in the stock price. Traders should be cautious of the overbought conditions indicated by momentum indicators and the narrowing Bollinger Bands suggesting reduced volatility. It is advisable to closely monitor key support and resistance levels for potential trading opportunities.