Technical Analysis of NFLY 2024-05-10
Overview:
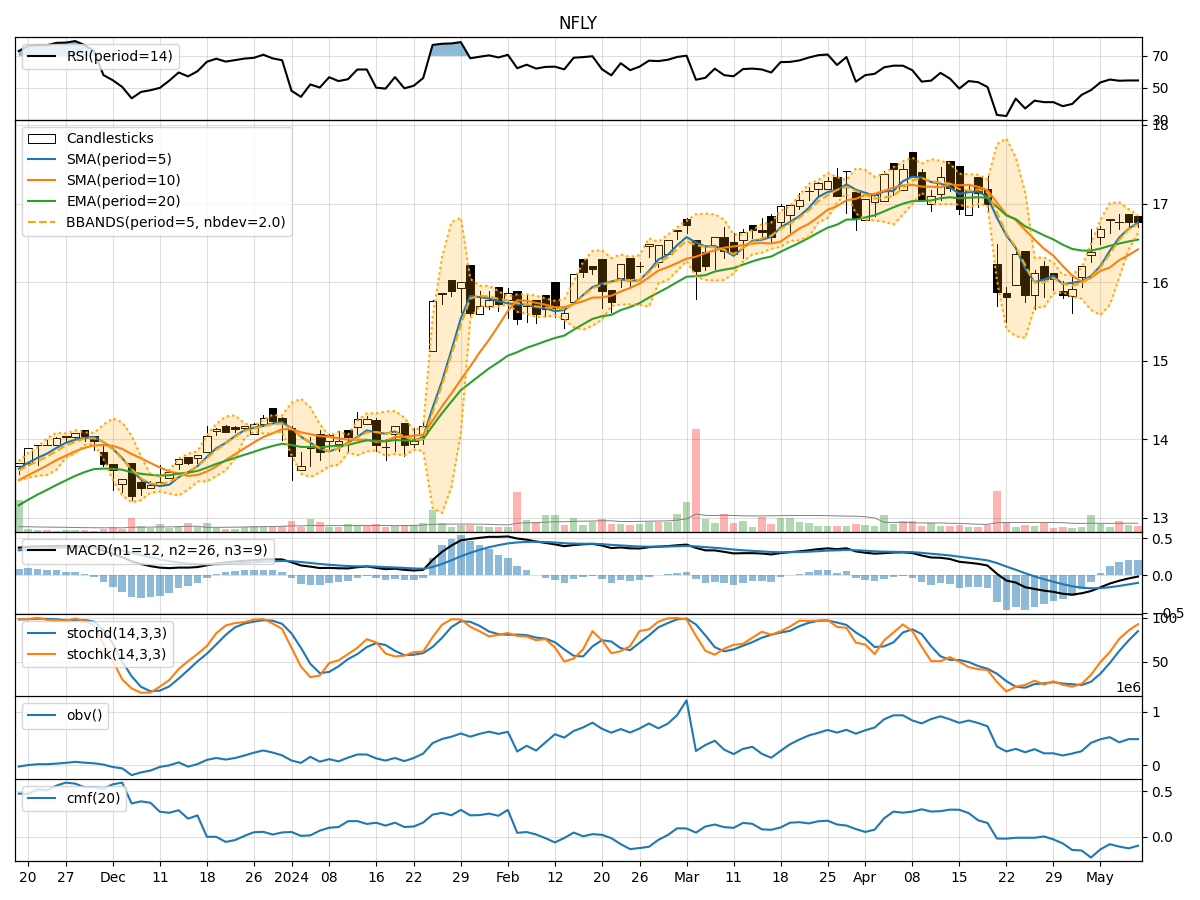
In analyzing the technical indicators for NFLY over the last 5 days, we will delve into the trend, momentum, volatility, and volume indicators to provide a comprehensive outlook on the possible stock price movement in the coming days. By examining key metrics such as moving averages, MACD, RSI, Bollinger Bands, and OBV, we aim to offer valuable insights and predictions for potential price action.
Trend Indicators:
- Moving Averages (MA): The 5-day moving average has been consistently above the closing prices, indicating a short-term uptrend.
- MACD: The MACD line has been negative but trending towards the signal line, suggesting a potential bullish crossover.
- EMA: The exponential moving average has been relatively stable, reflecting a gradual uptrend.
Key Observation: The trend indicators point towards a slight bullish bias in the short term.
Momentum Indicators:
- RSI: The RSI has been hovering around the neutral zone, indicating a balanced momentum.
- Stochastic Oscillator: Both %K and %D have been in overbought territory, signaling a potential reversal.
- Williams %R: The indicator has been consistently in oversold territory, suggesting a possible buying opportunity.
Key Observation: Momentum indicators suggest a mixed sentiment with a slight bearish bias.
Volatility Indicators:
- Bollinger Bands: The price has been trading within the bands, indicating a period of consolidation.
- Bollinger %B: The %B indicator has been relatively stable, reflecting a lack of extreme price movements.
Key Observation: Volatility indicators signal a sideways movement in the near term.
Volume Indicators:
- On-Balance Volume (OBV): The OBV has been fluctuating but has not shown a clear trend, indicating indecision among market participants.
- Chaikin Money Flow (CMF): The CMF has been negative, suggesting selling pressure in the stock.
Key Observation: Volume indicators reflect uncertainty in the market sentiment.
Conclusion:
Based on the analysis of trend, momentum, volatility, and volume indicators, the next few days for NFLY are likely to see sideways movement with a slight bullish bias. Traders should exercise caution and closely monitor key levels such as the moving averages and MACD for potential trend reversals. Additionally, keeping an eye on the Stochastic Oscillator for any signs of a reversal in overbought territory will be crucial. Overall, a cautious approach with a focus on risk management is recommended in the current market environment.
Key Takeaways:
- Trend: Slight bullish bias
- Momentum: Mixed sentiment with a slight bearish bias
- Volatility: Sideways movement
- Volume: Uncertainty and selling pressure
By combining insights from various technical indicators, traders can make informed decisions and adapt their strategies accordingly to navigate the dynamic market conditions effectively.