Technical Analysis of NFRA 2024-05-10
Overview:
In analyzing the technical indicators for NFRA over the last 5 days, we will delve into the trends, momentum, volatility, and volume indicators to provide a comprehensive outlook on the possible stock price movement in the coming days. By examining these key indicators, we aim to offer valuable insights and predictions for informed decision-making.
Trend Indicators:
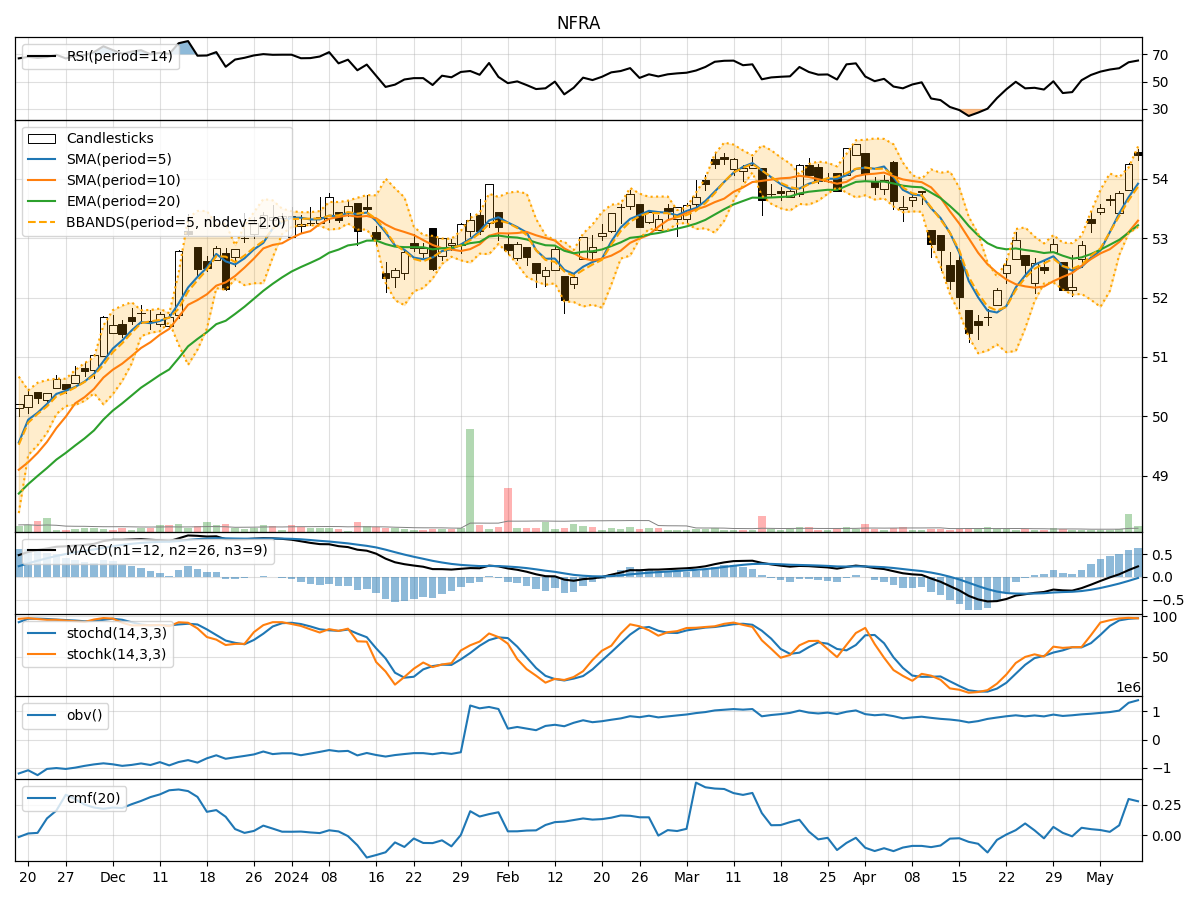
- Moving Averages (MA): The 5-day Moving Average (MA) has been consistently above the Simple Moving Average (SMA) and Exponential Moving Average (EMA), indicating a bullish trend.
- MACD: The MACD line has been consistently above the signal line, with both lines showing an upward trend, suggesting bullish momentum.
- MACD Histogram: The MACD Histogram has been increasing over the past 5 days, indicating strengthening bullish momentum.
Momentum Indicators:
- RSI: The Relative Strength Index (RSI) has been trending upwards and is currently in the overbought territory, suggesting a strong bullish momentum.
- Stochastic Oscillator: Both %K and %D lines of the Stochastic Oscillator are in the overbought zone, indicating a potential reversal or consolidation.
- Williams %R: The Williams %R is in the oversold territory, signaling a potential reversal to the upside.
Volatility Indicators:
- Bollinger Bands: The price has been trading within the Bollinger Bands, with the bands widening slightly, indicating increased volatility.
- Bollinger %B: The Bollinger %B is below 1, suggesting that the price is currently below the upper band, potentially indicating a short-term pullback.
Volume Indicators:
- On-Balance Volume (OBV): The OBV has been increasing over the last 5 days, indicating strong buying pressure.
- Chaikin Money Flow (CMF): The CMF is positive and has been trending upwards, indicating accumulation by investors.
Conclusion:
Based on the analysis of the technical indicators, the next few days' possible stock price movement for NFRA is likely to be bullish. The trend indicators, momentum indicators, and volume indicators all point towards a continuation of the current upward trend. However, caution should be exercised as the Stochastic Oscillator suggests a potential reversal or consolidation in the near term. Traders and investors should closely monitor the price action and key support/resistance levels for timely decision-making.
In summary, the overall outlook for NFRA is bullish, with the potential for further upside movement in the coming days.