Technical Analysis of NFTY 2024-05-10
Overview:
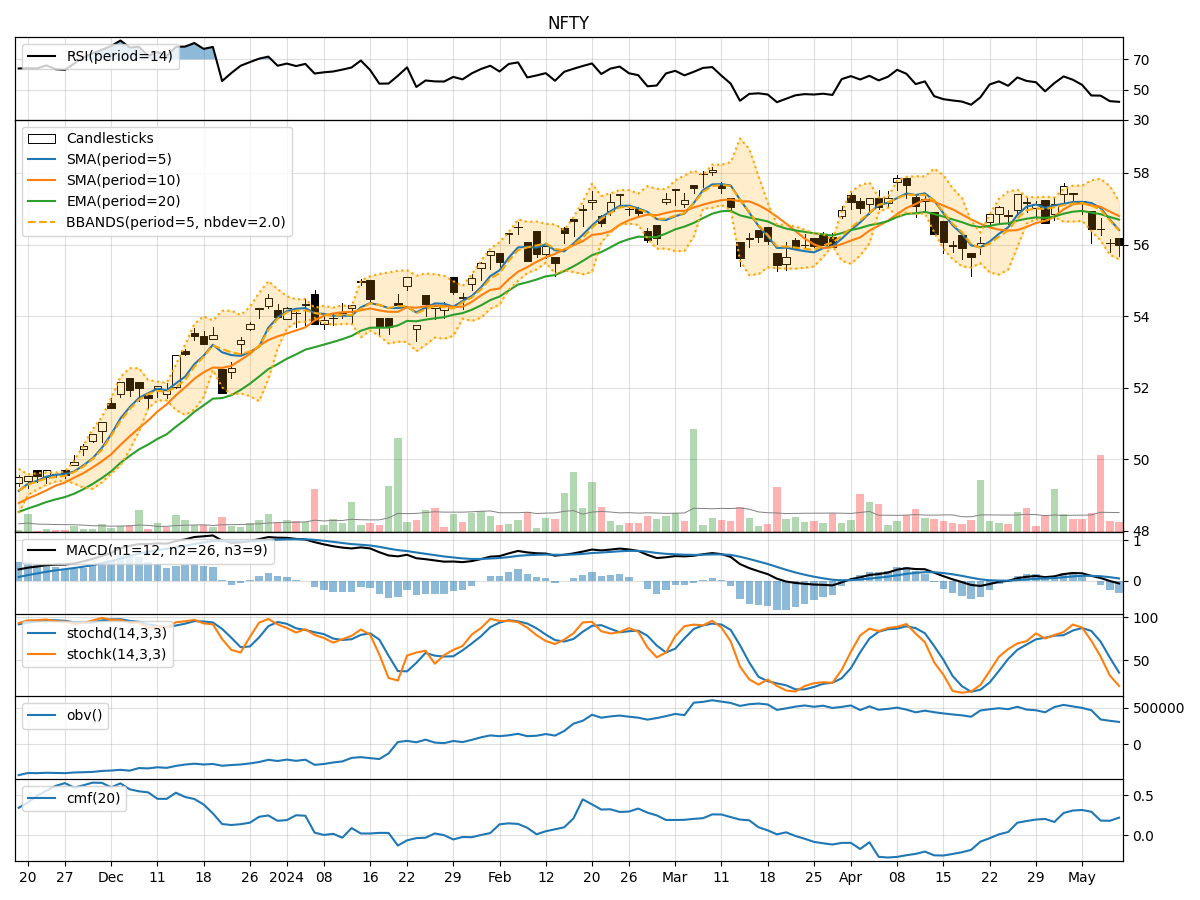
In analyzing the technical indicators for NFTY over the last 5 days, we will delve into the trend, momentum, volatility, and volume indicators to provide a comprehensive outlook on the possible stock price movement in the coming days. By examining key metrics such as moving averages, MACD, RSI, Stochastic Oscillator, Bollinger Bands, OBV, and Chaikin Money Flow, we aim to offer valuable insights and predictions for informed decision-making.
Trend Indicators:
- Moving Averages (MA): The 5-day MA has been consistently below the closing price, indicating a short-term bearish trend.
- MACD: The MACD line has been below the signal line, suggesting a bearish momentum.
- EMA: The EMA has been declining, reflecting a weakening trend.
- Conclusion: The trend indicators point towards a downward trajectory for NFTY.
Momentum Indicators:
- RSI: The RSI has been decreasing, signaling a loss in bullish momentum.
- Stochastic Oscillator: Both %K and %D have been declining, indicating a bearish momentum.
- Conclusion: Momentum indicators support a bearish outlook for NFTY.
Volatility Indicators:
- Bollinger Bands (BB): The price has been consistently below the middle band, suggesting a lack of volatility.
- BB Width: The bands have been narrowing, indicating decreasing volatility.
- Conclusion: Volatility indicators imply a sideways or consolidation phase for NFTY.
Volume Indicators:
- On-Balance Volume (OBV): The OBV has been relatively stable, showing no significant divergence.
- Chaikin Money Flow (CMF): The CMF has been positive but decreasing, indicating weakening buying pressure.
- Conclusion: Volume indicators suggest a neutral stance for NFTY.
Overall Conclusion:
Based on the analysis of trend, momentum, volatility, and volume indicators, the next few days for NFTY are likely to see a downward movement in stock price. The bearish trend and momentum indicators, coupled with stable volume and low volatility, indicate a potential continuation of the current downtrend. Traders and investors should exercise caution and consider short-term selling opportunities or wait for a clearer signal before entering new positions.
Key Takeaways:
- Trend: Downward
- Momentum: Bearish
- Volatility: Sideways/Consolidation
- Volume: Neutral
Recommendation:
Given the overall bearish sentiment in the technical indicators, it is advisable to monitor the price action closely and wait for confirmation of a reversal before considering long positions. Short-term traders may find opportunities to capitalize on the downward movement, while long-term investors should wait for a more favorable entry point. Risk management and stop-loss strategies are crucial in navigating the current market conditions.