Technical Analysis of NJAN 2024-05-10
Overview:
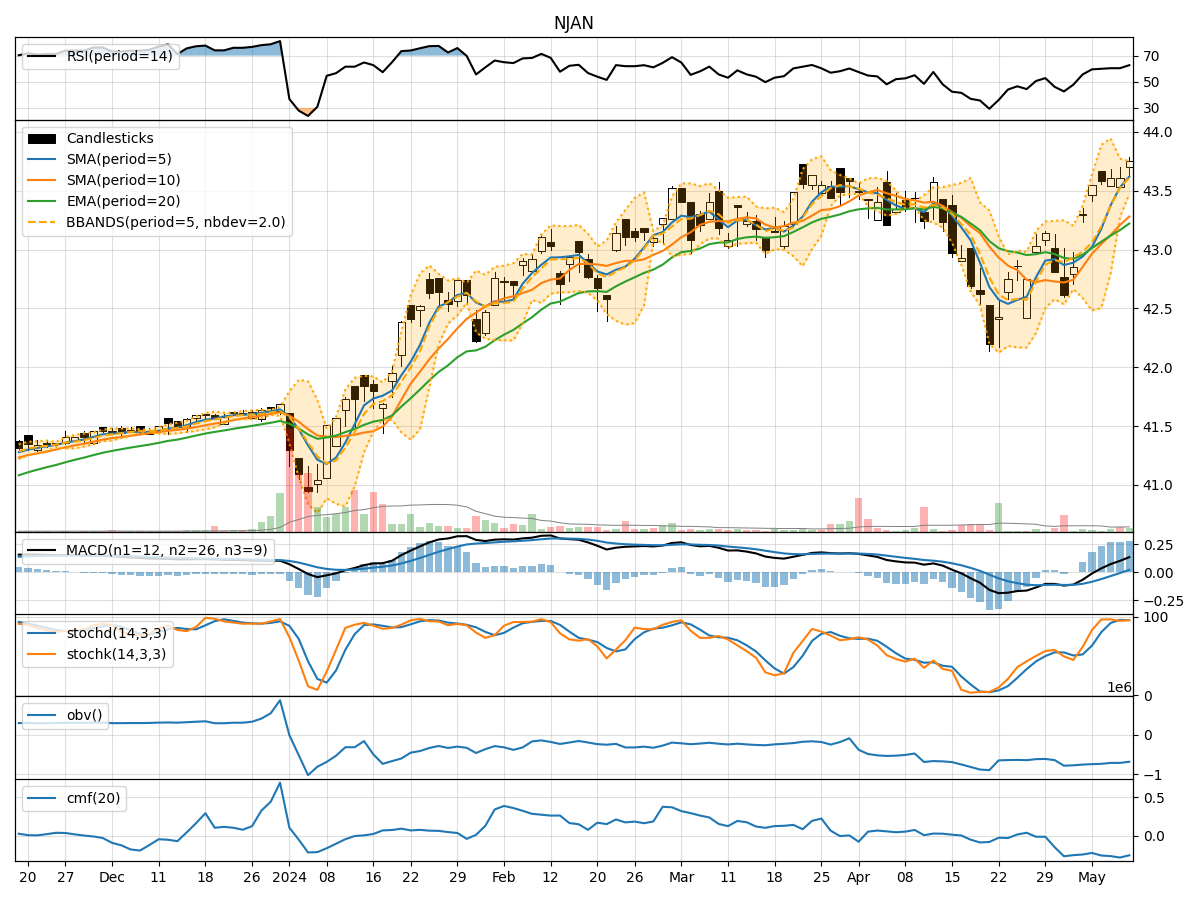
In the last 5 trading days, NJAN stock has shown a consistent uptrend in its price, with increasing volumes. The moving averages have been trending upwards, indicating a positive momentum. The MACD and RSI have also been showing bullish signals. However, the stock is currently trading near its upper Bollinger Band, suggesting a potential overbought condition.
Trend Indicators Analysis:
- Moving Averages (MA): The 5-day MA has been consistently above the 10-day SMA, indicating a short-term bullish trend.
- MACD: The MACD line has been above the signal line for the past few days, indicating a bullish momentum.
- EMA: The EMA has been trending upwards, supporting the bullish sentiment.
Momentum Indicators Analysis:
- RSI: The RSI has been in the overbought territory, suggesting a strong bullish momentum.
- Stochastic Oscillator: Both %K and %D have been in the overbought zone, indicating a potential reversal or consolidation.
- Williams %R: The Williams %R is also in the overbought region, signaling a possible pullback.
Volatility Indicators Analysis:
- Bollinger Bands: The stock price is currently near the upper Bollinger Band, indicating a potential overbought condition. A breakout above this level could signal further upside, while a reversal from here could lead to a pullback.
- Bollinger %B: The %B is above 0.8, suggesting a potential overbought condition.
Volume Indicators Analysis:
- On-Balance Volume (OBV): The OBV has been declining, indicating some distribution happening in the stock.
- Chaikin Money Flow (CMF): The CMF has been negative, suggesting selling pressure in the stock.
Key Observations and Opinions:
- The stock has been in a strong uptrend, supported by moving averages, MACD, and RSI.
- However, the stock is currently overbought according to the Bollinger Bands and other momentum indicators.
- The volume indicators show some signs of distribution and selling pressure.
Conclusion:
Based on the technical indicators and analysis: - Short-Term View: The stock may experience a short-term pullback or consolidation due to overbought conditions and selling pressure indicated by volume indicators. - Medium- to Long-Term View: The overall trend remains bullish, but caution is advised due to the potential for a short-term correction.
Recommendation:
- Short-Term Traders: Consider taking profits or setting tight stop-loss orders to protect gains.
- Long-Term Investors: Hold onto positions but monitor closely for any signs of a trend reversal.
Overall Assessment:
The stock is currently in an overbought state and may experience a short-term pullback or consolidation before potentially resuming its uptrend. It is essential to monitor key support levels and volume dynamics for further insights into the stock's future price movements.