Technical Analysis of NJUL 2024-05-10
Overview:
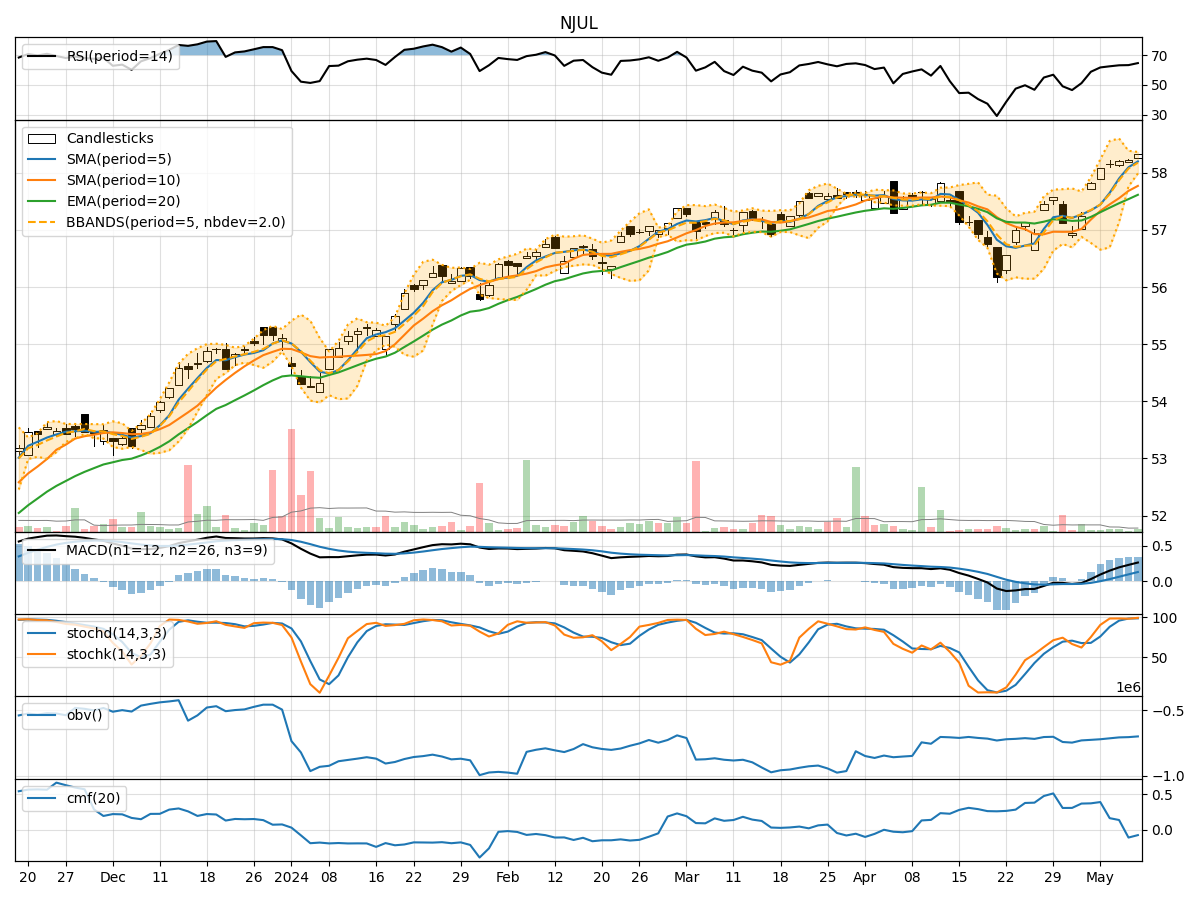
In analyzing the technical indicators for NJUL stock over the last 5 days, we will delve into the trend, momentum, volatility, and volume indicators to provide a comprehensive outlook on the possible stock price movement in the coming days. By examining these key indicators, we aim to offer valuable insights and predictions for informed decision-making.
Trend Indicators:
- Moving Averages (MA): The 5-day Moving Average (MA) has been consistently above the Simple Moving Average (SMA) and Exponential Moving Average (EMA), indicating a bullish trend.
- MACD: The MACD line has been consistently above the signal line, with both lines showing an upward trend, suggesting bullish momentum.
- Conclusion: The trend indicators point towards an upward trend for NJUL stock.
Momentum Indicators:
- RSI: The Relative Strength Index (RSI) has been increasing steadily and is currently in the overbought territory, indicating strong buying momentum.
- Stochastic Oscillator: Both %K and %D lines of the Stochastic Oscillator are in the overbought zone, suggesting a potential reversal.
- Conclusion: Momentum indicators signal a potential pullback or consolidation in the near term.
Volatility Indicators:
- Bollinger Bands (BB): The stock price has been trading within the upper Bollinger Band (BBU), indicating high volatility.
- Conclusion: Volatility indicators suggest increased volatility in the stock price.
Volume Indicators:
- On-Balance Volume (OBV): The OBV has been increasing, indicating accumulation by investors.
- Chaikin Money Flow (CMF): The CMF has been positive but showing a slight decline, suggesting weakening buying pressure.
- Conclusion: Volume indicators imply positive accumulation but with a slight weakening of buying pressure.
Overall Conclusion:
Based on the analysis of trend, momentum, volatility, and volume indicators, the next few days for NJUL stock are likely to see a continuation of the upward trend with the potential for a short-term pullback or consolidation due to overbought conditions in momentum indicators. The increased volatility may lead to some fluctuations in the stock price, but the overall trend remains bullish. Investors should monitor the stock closely for potential entry or exit points based on their risk tolerance and investment horizon.
Key Recommendations:
- Long-Term Investors: Hold onto positions with a bullish view on the stock.
- Short-Term Traders: Consider taking profits or tightening stop-loss levels due to potential pullback signals.
- Risk Management: Implement proper risk management strategies to navigate the increased volatility in the stock price.
In conclusion, while the overall outlook for NJUL stock remains bullish, caution is advised due to the potential for a short-term pullback. Stay vigilant and adapt your trading strategy accordingly to capitalize on market opportunities.