Technical Analysis of NLR 2024-05-10
Overview:
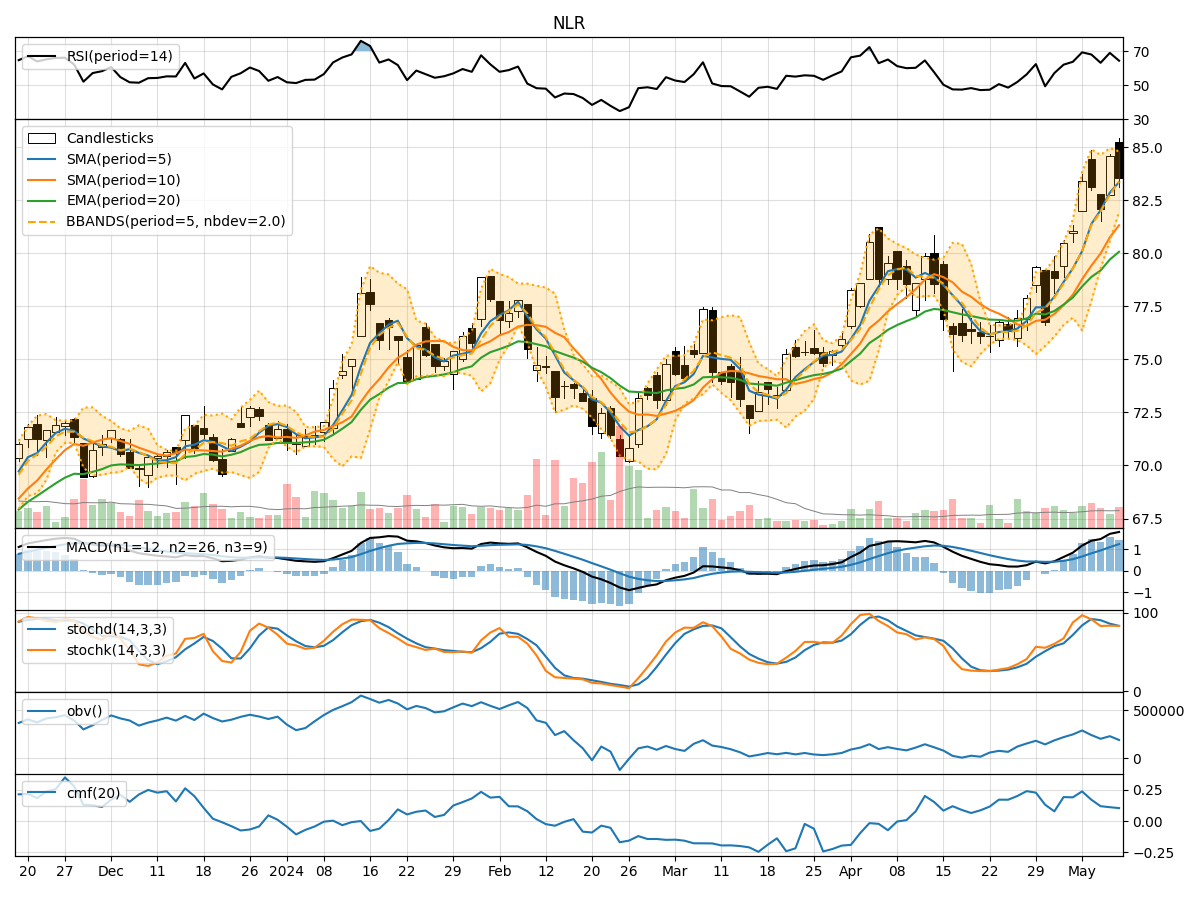
In analyzing the technical indicators for NLR stock over the last 5 days, we will delve into the trends, momentum, volatility, and volume aspects to provide a comprehensive outlook on the possible stock price movement in the coming days. By examining key indicators such as moving averages, MACD, RSI, Bollinger Bands, and OBV, we aim to offer valuable insights and predictions for potential price action.
Trend Analysis:
- Moving Averages (MA): The 5-day moving average has been consistently trending upwards, indicating a bullish momentum in the short term.
- MACD: The MACD line has been above the signal line for the past 5 days, suggesting a bullish trend.
- EMA: The exponential moving average has also been on an upward trajectory, supporting the bullish sentiment.
Momentum Analysis:
- RSI: The Relative Strength Index has shown fluctuations but generally remains in the neutral to slightly overbought territory, indicating a balanced momentum.
- Stochastic Oscillator: Both %K and %D have been fluctuating, suggesting indecision in momentum direction.
- Williams %R: The Williams %R has been oscillating between oversold and neutral levels, reflecting mixed momentum signals.
Volatility Analysis:
- Bollinger Bands: The stock price has mostly remained within the Bollinger Bands, with occasional breaches, indicating moderate volatility.
- Bollinger Band Width: The band width has fluctuated, suggesting periods of both high and low volatility.
- Bollinger Band %B: The %B indicator has shown variability, reflecting changing volatility levels.
Volume Analysis:
- On-Balance Volume (OBV): The OBV has been declining over the past 5 days, indicating a decrease in buying pressure.
- Chaikin Money Flow (CMF): The CMF has also been decreasing, signaling a potential outflow of money from the stock.
Key Observations:
- The trend indicators suggest a bullish sentiment in the short term.
- Momentum indicators show mixed signals with no clear direction.
- Volatility has been moderate with occasional spikes.
- Volume indicators point towards a decrease in buying pressure and potential outflows.
Conclusion:
Based on the analysis of the technical indicators, the next few days for NLR stock could see sideways movement with a slight bearish bias. The mixed signals from momentum indicators, coupled with decreasing buying pressure and outflows indicated by volume indicators, suggest a lack of strong bullish momentum. While the trend indicators remain positive, the overall picture points towards a period of consolidation or mild correction. Traders may consider adopting a cautious approach and closely monitor key support and resistance levels for potential entry or exit points.