Technical Analysis of NORW 2024-05-10
Overview:
In analyzing the technical indicators for NORW over the last 5 days, we will delve into the trend, momentum, volatility, and volume indicators to provide a comprehensive outlook on the possible stock price movement. By examining these key aspects, we aim to offer valuable insights and predictions for the upcoming days.
Trend Analysis:
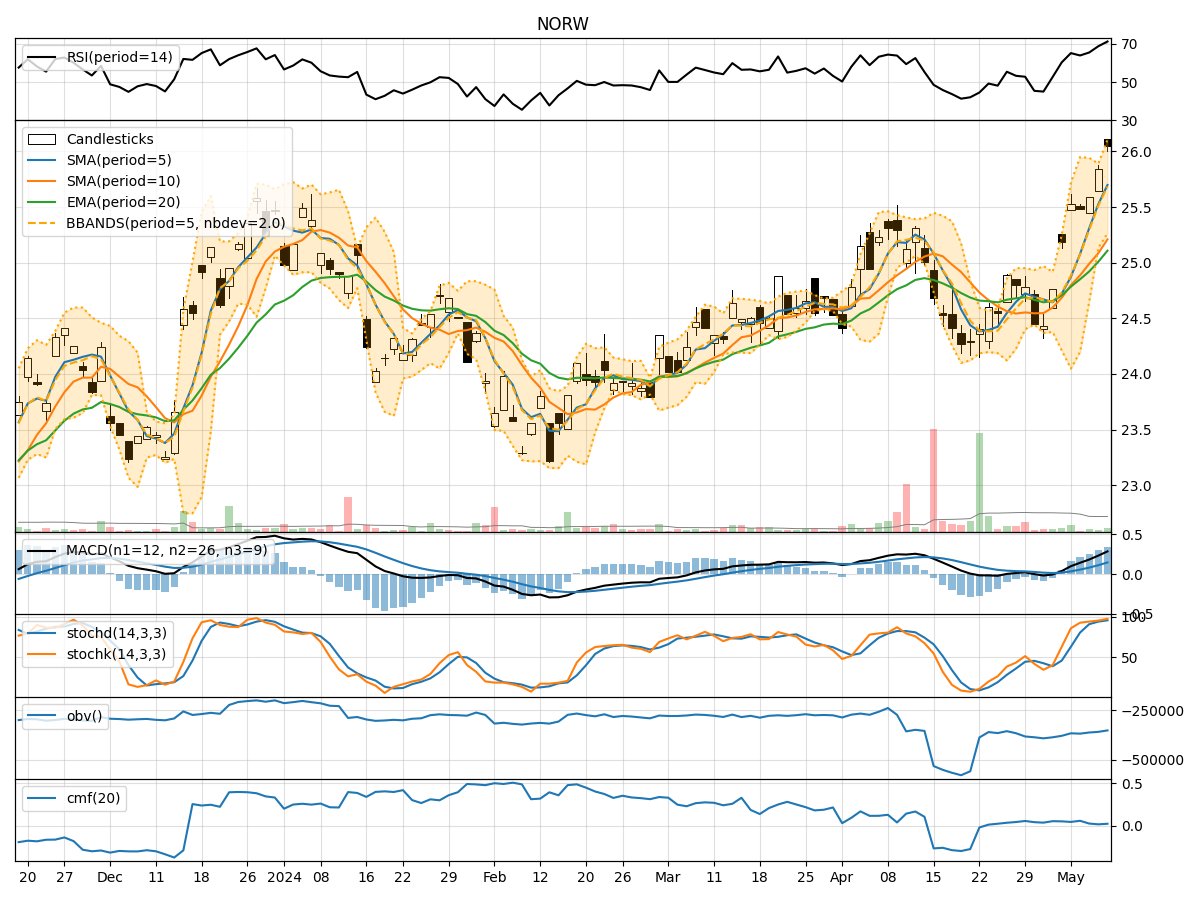
- Moving Averages (MA): The 5-day Moving Average (MA) has been consistently rising, indicating a bullish trend in the short term.
- MACD: The MACD line has been above the signal line, suggesting positive momentum in the stock price.
- RSI: The Relative Strength Index (RSI) has been increasing, reaching overbought levels, signaling potential strength in the stock.
Momentum Analysis:
- Stochastic Oscillator: Both %K and %D have been in the overbought zone, indicating strong upward momentum.
- Williams %R: The Williams %R is in the oversold territory, suggesting a potential reversal or consolidation.
Volatility Analysis:
- Bollinger Bands (BB): The stock price has been trading near the upper Bollinger Band, indicating high volatility and a potential overbought condition.
- Volatility Bands: The volatility bands have been widening, suggesting increased price fluctuations.
Volume Analysis:
- On-Balance Volume (OBV): The OBV has been declining, indicating selling pressure in the stock.
- Chaikin Money Flow (CMF): The CMF has been positive but decreasing, signaling a potential decrease in buying pressure.
Key Observations:
- The stock is currently in a bullish trend based on moving averages and MACD.
- Momentum indicators suggest strong upward momentum but also hint at a possible reversal with Williams %R in the oversold zone.
- Volatility is high, as indicated by the Bollinger Bands, which could lead to increased price fluctuations.
- Volume analysis shows selling pressure with a declining OBV.
Conclusion:
Based on the analysis of technical indicators, the next few days for NORW could see continued bullish movement in the stock price, supported by the positive trend and momentum indicators. However, caution is advised due to the high volatility and potential reversal signals from the Williams %R indicator. Traders should closely monitor price action and consider implementing risk management strategies to navigate the market dynamics effectively.