Technical Analysis of NPFI 2024-05-10
Overview:
In analyzing the technical indicators for the stock based on the last 5 days of data, we will delve into the trend, momentum, volatility, and volume indicators to provide a comprehensive outlook on the possible stock price movement in the coming days. By examining these key indicators, we aim to offer valuable insights and predictions to guide your investment decisions.
Trend Indicators:
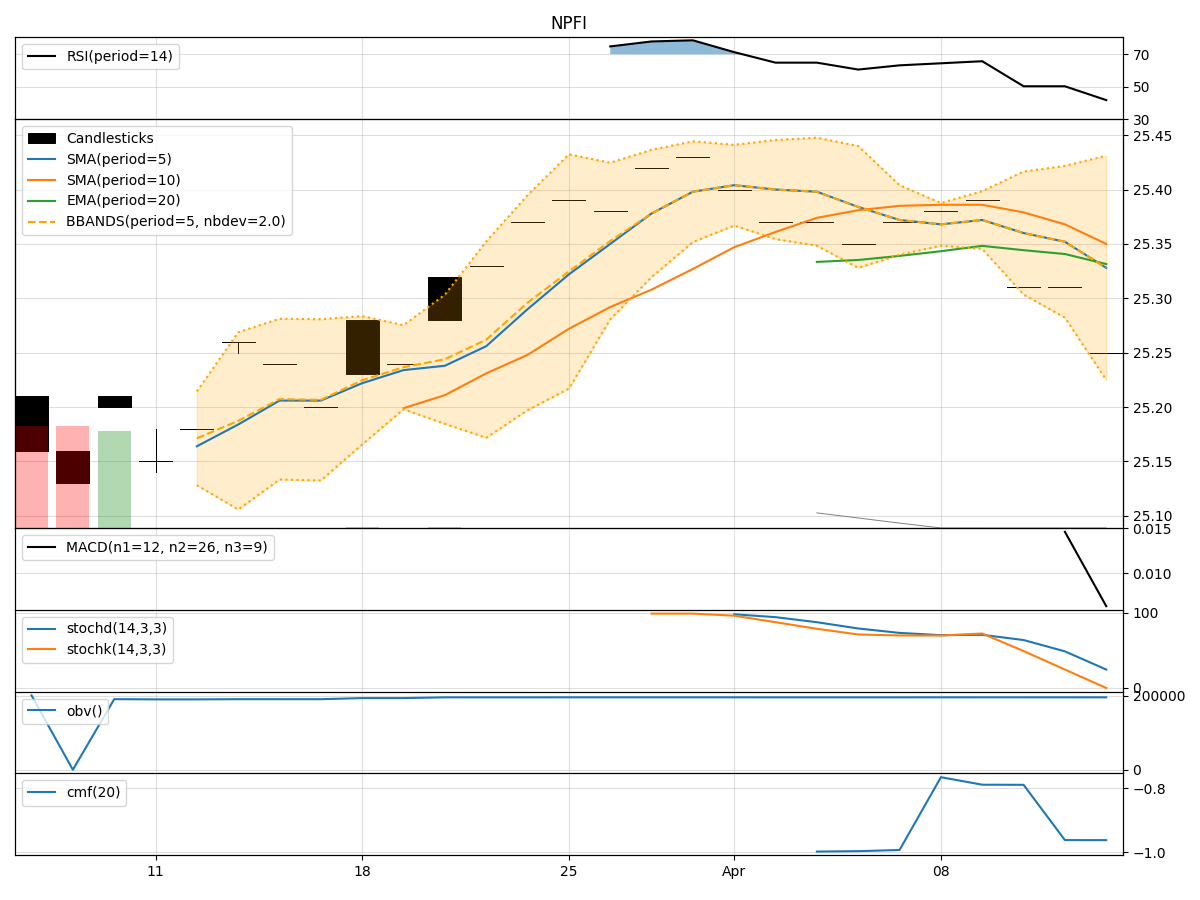
- Moving Averages (MA): The stock's closing price has been consistently above the 5-day Moving Average, indicating a bullish trend.
- MACD (Moving Average Convergence Divergence): The MACD line has been consistently above the signal line, suggesting a bullish momentum.
- RSI (Relative Strength Index): The RSI values have been in the overbought territory, indicating a strong bullish momentum.
Momentum Indicators:
- Stochastic Oscillator: The Stochastic Oscillator values have been consistently high, indicating a strong bullish momentum.
- Williams %R (Willams Percentage Range): The Williams %R values have been consistently at 0, suggesting an overbought condition.
Volatility Indicators:
- Bollinger Bands (BB): The stock price has been trading within the upper Bollinger Band, indicating an increased volatility.
- Average True Range (ATR): The ATR values have been relatively stable, suggesting consistent volatility levels.
Volume Indicators:
- On-Balance Volume (OBV): The OBV values have been relatively flat, indicating a neutral volume trend.
- Chaikin Money Flow (CMF): The CMF values have been consistently at 0, suggesting a lack of significant buying or selling pressure.
Key Observations and Opinions:
- Trend: The stock is currently in a strong bullish trend based on the moving averages and MACD indicators.
- Momentum: Momentum indicators like RSI and Stochastic Oscillator suggest an overbought condition, indicating a potential reversal or consolidation.
- Volatility: The stock has exhibited increased volatility based on the Bollinger Bands, which could lead to larger price swings.
- Volume: The volume indicators show a lack of significant buying or selling pressure, indicating a sideways movement in volume.
Conclusion:
Based on the analysis of the technical indicators, the stock is currently in a bullish trend with strong momentum. However, the overbought conditions indicated by the momentum indicators suggest a potential reversal or consolidation in the near future. The increased volatility could lead to larger price swings, while the lack of significant volume trends indicates a sideways movement in volume. Therefore, it is advisable to exercise caution and closely monitor the stock for potential reversals or consolidation patterns in the coming days.