Technical Analysis of NRES 2024-05-10
Overview:
In the last 5 trading days, NRES stock has shown a mixed performance based on various technical indicators. The trend indicators suggest a slightly positive trend with the moving averages and MACD showing a gradual increase. Momentum indicators indicate a strengthening momentum, while volatility indicators show relatively stable price movements. Volume indicators suggest a neutral to slightly positive sentiment.
Trend Indicators Analysis:
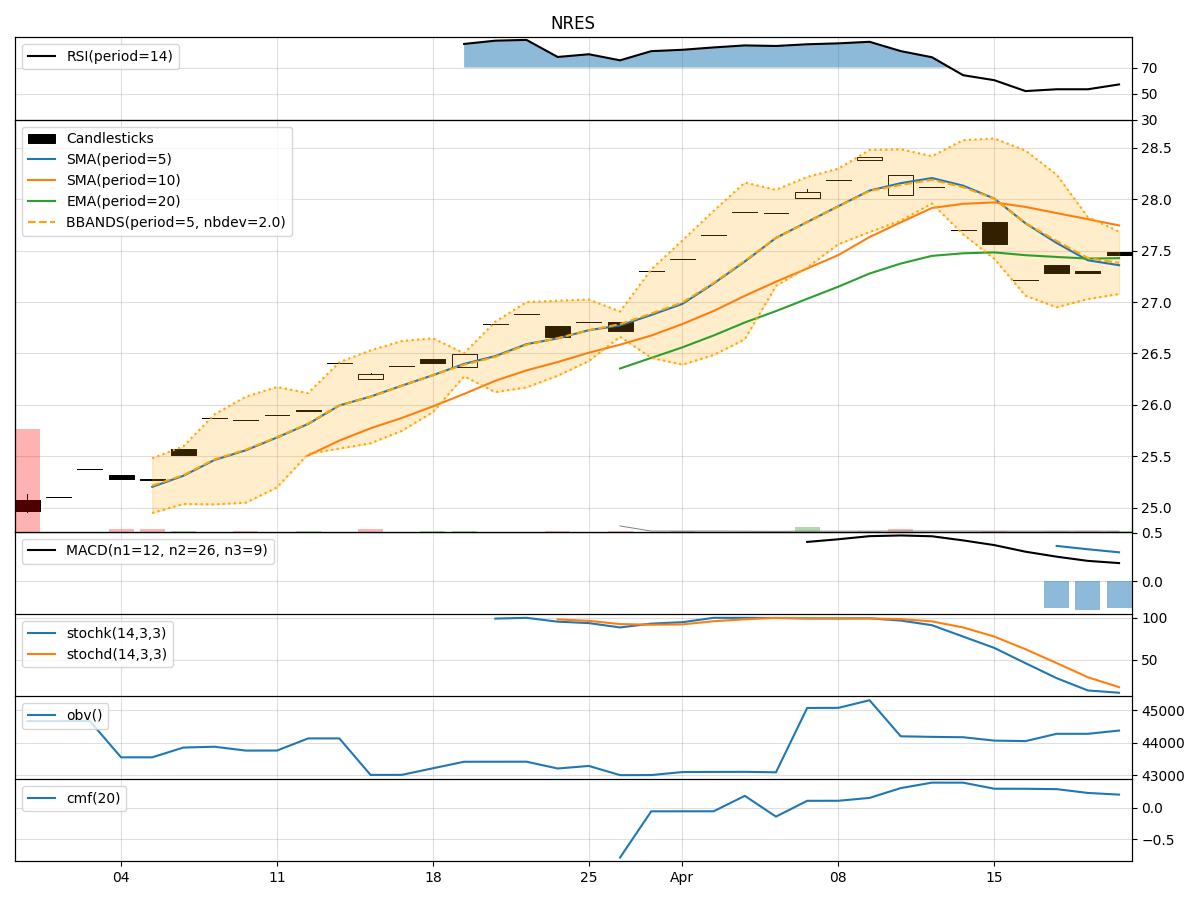
- Moving Averages (MA): The 5-day MA has been consistently above the closing price, indicating a positive short-term trend.
- MACD: The MACD line has been trending upwards, crossing above the signal line, indicating a potential bullish signal.
- EMA: The EMA has been gradually increasing, supporting the positive trend.
Key Observation: The trend indicators overall suggest a bullish sentiment in the short term.
Momentum Indicators Analysis:
- RSI: The RSI has been in the neutral to slightly overbought territory, indicating a strengthening momentum.
- Stochastic Oscillator: Both %K and %D have been in the overbought zone, suggesting a strong buying momentum.
- Williams %R: The Williams %R is close to the oversold territory, indicating a potential reversal.
Key Observation: Momentum indicators suggest a bullish momentum in the short term.
Volatility Indicators Analysis:
- Bollinger Bands (BB): The price has been trading within the bands, indicating stable volatility.
- Bollinger %B: The %B is close to 1, suggesting the price is near the upper band.
- Average True Range (ATR): ATR has been relatively stable, indicating consistent price movements.
Key Observation: Volatility indicators suggest a sideways movement with stable price fluctuations.
Volume Indicators Analysis:
- On-Balance Volume (OBV): The OBV has been slightly negative, indicating some distribution.
- Chaikin Money Flow (CMF): The CMF has been positive, suggesting buying pressure.
Key Observation: Volume indicators suggest a neutral to slightly positive sentiment.
Conclusion:
Based on the analysis of the technical indicators, the next few days for NRES stock are likely to see a continuation of the bullish trend in the short term. The positive trend and momentum indicators, coupled with stable volatility and slightly positive volume indicators, support this outlook. Traders and investors may consider buying opportunities in the stock for potential short-term gains. However, it is essential to monitor the indicators closely for any signs of reversal or trend exhaustion.