Technical Analysis of NRSH 2024-05-10
Overview:
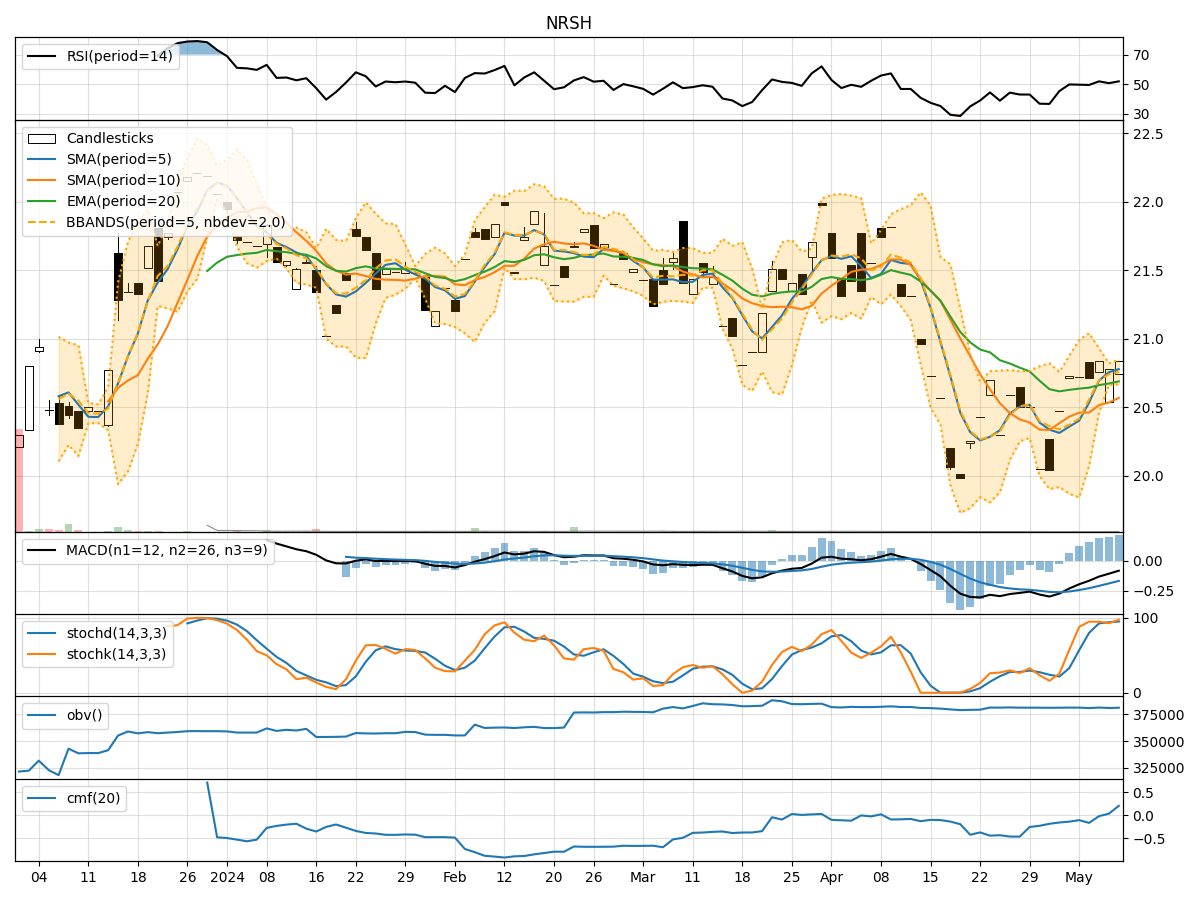
In analyzing the technical indicators for NRSH over the last 5 days, we will delve into the trend, momentum, volatility, and volume indicators to provide a comprehensive outlook on the possible stock price movement in the coming days. By examining key metrics such as moving averages, MACD, RSI, Bollinger Bands, and OBV, we aim to offer valuable insights and predictions for potential price action.
Trend Indicators:
- Moving Averages (MA): The 5-day moving average has been consistently above the closing prices, indicating a short-term uptrend.
- MACD: The MACD line has been gradually increasing, showing a potential bullish momentum.
- MACD Histogram: The histogram has been rising, suggesting increasing bullish momentum.
Momentum Indicators:
- RSI: The RSI has been fluctuating around the neutral zone, indicating a lack of strong momentum.
- Stochastic Oscillator: Both %K and %D have been in overbought territory, signaling a potential reversal.
- Williams %R: The indicator has been hovering near oversold levels, suggesting a possible buying opportunity.
Volatility Indicators:
- Bollinger Bands: The stock price has been trading within the bands, indicating a period of consolidation.
- Bollinger %B: The %B value has been fluctuating around the midline, reflecting a balanced market sentiment.
Volume Indicators:
- On-Balance Volume (OBV): The OBV has shown mixed signals, reflecting indecision among market participants.
- Chaikin Money Flow (CMF): The CMF has been negative, indicating selling pressure in the market.
Key Observations:
- The trend indicators suggest a bullish bias in the short term.
- Momentum indicators show a lack of strong momentum, potentially leading to a consolidation phase.
- Volatility indicators point towards a period of sideways movement.
- Volume indicators reflect mixed signals, indicating uncertainty among investors.
Conclusion:
Based on the analysis of the technical indicators, the next few days for NRSH could see sideways movement with a slight upward bias. Traders should exercise caution and closely monitor key support and resistance levels for potential breakout opportunities. It is advisable to wait for clearer signals from the indicators before making significant trading decisions.