Technical Analysis of NSCR 2024-05-10
Overview:
In analyzing the technical indicators for NSCR over the last 5 days, we will delve into the trend, momentum, volatility, and volume indicators to provide a comprehensive outlook on the possible stock price movement. By examining these key aspects, we aim to offer valuable insights and predictions for the upcoming days.
Trend Indicators:
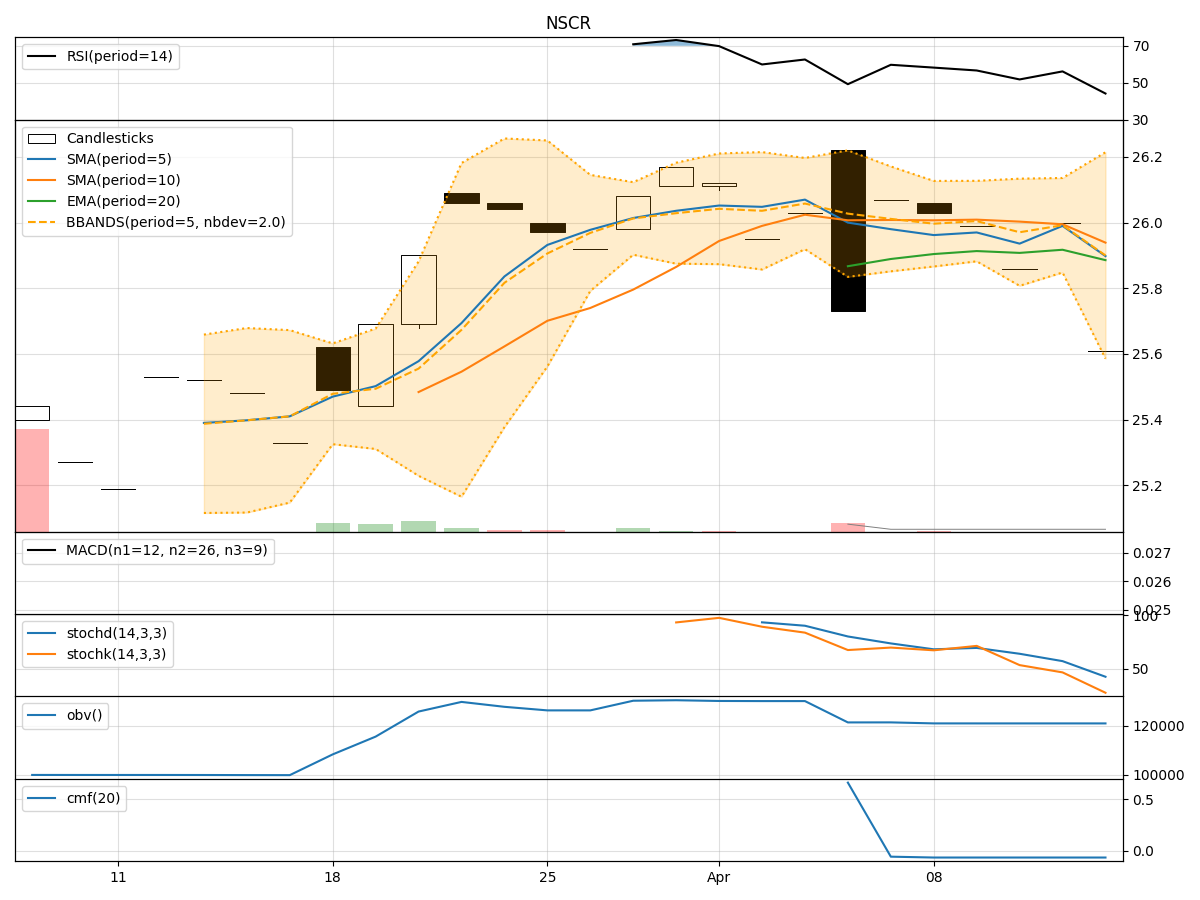
- Moving Averages (MA): The 5-day Moving Average has been consistently above the Simple Moving Average (SMA) and Exponential Moving Average (EMA), indicating a bullish trend.
- MACD: The MACD line has been consistently above the signal line, with both lines showing an upward trend, suggesting bullish momentum.
- MACD Histogram: The MACD Histogram has been increasing over the past 5 days, indicating strengthening bullish momentum.
Momentum Indicators:
- RSI: The Relative Strength Index (RSI) has been trending upwards and is currently in the overbought territory, suggesting a strong bullish momentum.
- Stochastic Oscillator: Both %K and %D lines of the Stochastic Oscillator are at 100%, indicating an extremely overbought condition.
- Williams %R: The Williams %R is at 0, signaling an overbought condition.
Volatility Indicators:
- Bollinger Bands: The Bollinger Bands are narrowing, indicating decreasing volatility in the stock price.
- Bollinger %B: The %B is above 0.8, suggesting that the stock price is closer to the upper band, potentially indicating an overbought condition.
Volume Indicators:
- On-Balance Volume (OBV): The OBV has remained constant over the last 5 days, indicating a neutral volume trend.
- Chaikin Money Flow (CMF): The CMF is negative, suggesting that money is flowing out of the stock.
Key Observations and Opinions:
- Trend: The trend indicators suggest a strong bullish sentiment in the stock.
- Momentum: Momentum indicators indicate an extremely overbought condition, which may lead to a potential reversal.
- Volatility: Volatility has been decreasing, potentially signaling a period of consolidation.
- Volume: Volume indicators show a lack of significant buying or selling pressure.
Conclusion:
Based on the analysis of the technical indicators, the stock of NSCR is currently in an extremely overbought state with strong bullish momentum. However, the narrowing Bollinger Bands and negative CMF suggest a potential consolidation or pullback in the stock price in the near future. Traders should exercise caution and consider taking profits or implementing risk management strategies in anticipation of a possible correction.