Technical Analysis of NSCS 2024-05-10
Overview:
In analyzing the technical indicators for NSCS stock over the last 5 days, we will delve into the trend, momentum, volatility, and volume indicators to provide a comprehensive outlook on the possible future stock price movement. By examining these key indicators, we aim to offer valuable insights and predictions for the upcoming trading days.
Trend Analysis:
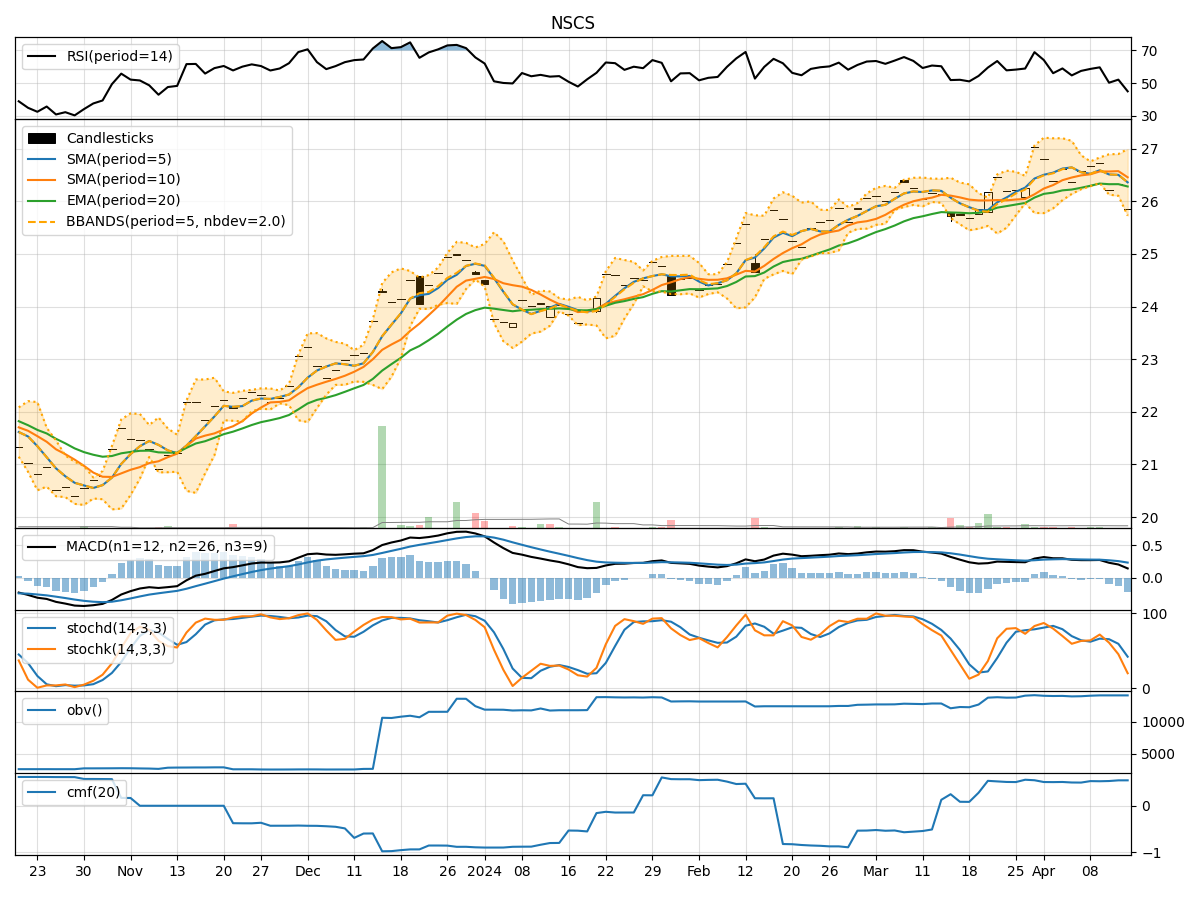
- Moving Averages (MA): The 5-day Moving Average (MA) has been consistently above the Simple Moving Average (SMA) and Exponential Moving Average (EMA), indicating a bullish trend.
- MACD: The MACD line has been consistently above the signal line, with the MACD histogram showing positive values, suggesting a bullish momentum.
Momentum Analysis:
- RSI: The Relative Strength Index (RSI) has been fluctuating around the 60-65 range, indicating a neutral momentum.
- Stochastic Oscillator: Both %K and %D have been in the overbought zone, suggesting a potential reversal or consolidation.
Volatility Analysis:
- Bollinger Bands (BB): The stock price has been trading within the Bollinger Bands, with the bands narrowing, indicating decreasing volatility.
Volume Analysis:
- On-Balance Volume (OBV): The OBV has shown slight fluctuations but no significant divergence, suggesting a neutral volume trend.
- Chaikin Money Flow (CMF): The CMF has consistently been at 0, indicating a balance between buying and selling pressure.
Key Observations:
- The trend indicators suggest a bullish sentiment, supported by the moving averages and MACD.
- Momentum indicators show a neutral stance, with RSI hovering in the mid-range and stochastic oscillators in the overbought zone.
- Volatility has been decreasing, as indicated by the narrowing Bollinger Bands.
- Volume indicators reflect a balanced volume trend, with no significant divergence in OBV and CMF.
Conclusion:
Based on the analysis of the technical indicators, the next few days' possible stock price movement for NSCS is likely to be sideways with a slight bullish bias. The bullish trend indicated by moving averages and MACD may support some upward movement, but the neutral momentum and overbought stochastic oscillators suggest a potential consolidation phase. The decreasing volatility and balanced volume further reinforce the expectation of a sideways movement in the upcoming trading sessions.
Recommendation:
- Short-term Traders: Consider taking profit on any bullish positions and wait for clearer signals before entering new trades.
- Long-term Investors: Monitor the price action closely for potential entry points during consolidation phases.
By combining insights from trend, momentum, volatility, and volume indicators, traders and investors can make informed decisions and adapt their strategies to the evolving market conditions. Remember to always conduct thorough research and risk management practices when making investment decisions.