Technical Analysis of NSI 2024-05-10
Overview:
In analyzing the technical indicators for NSI stock over the last 5 days, we will delve into the trend, momentum, volatility, and volume indicators to provide a comprehensive outlook on the possible stock price movement in the coming days. By examining these key aspects, we aim to offer valuable insights and predictions to guide your investment decisions.
Trend Analysis:
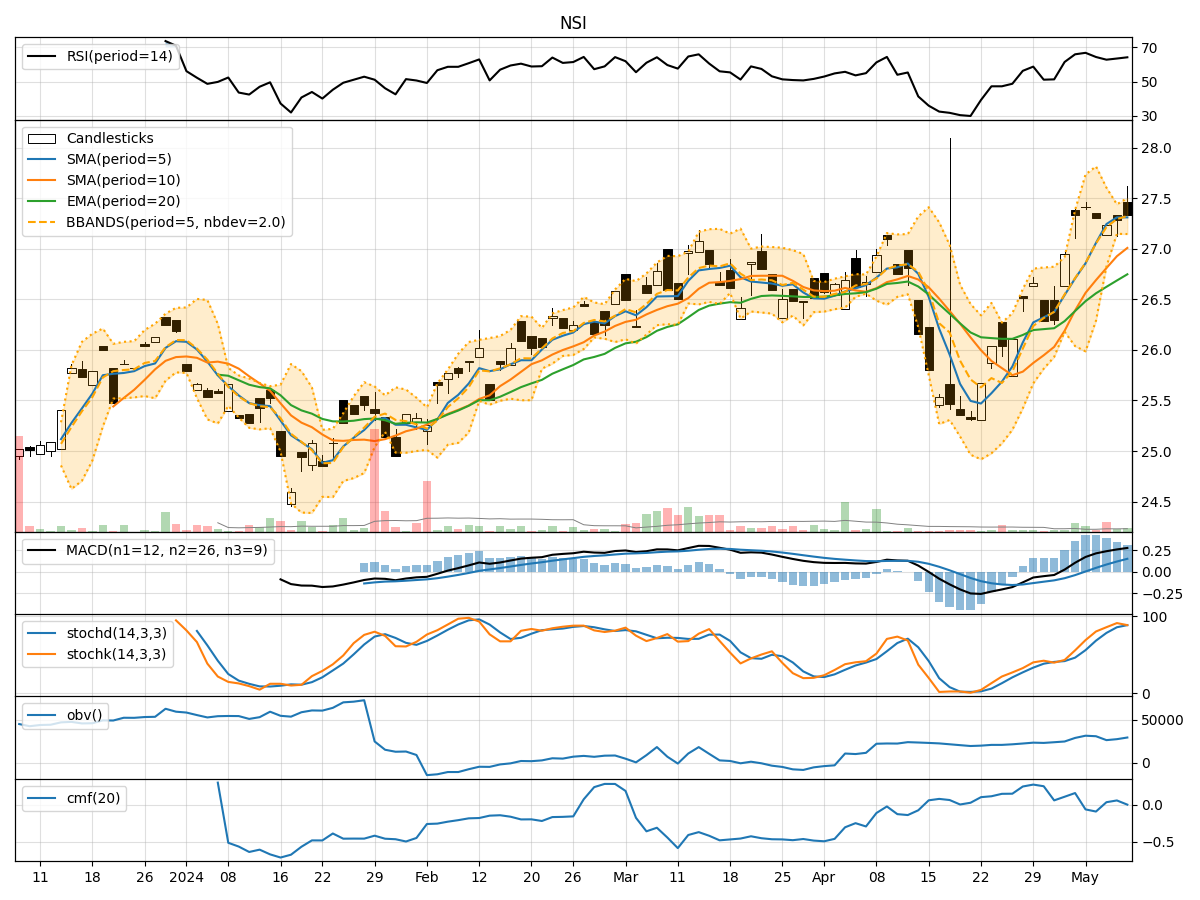
- Moving Averages (MA): The 5-day Moving Average (MA) has been consistently above the Simple Moving Average (SMA) and Exponential Moving Average (EMA), indicating a bullish trend.
- MACD: The MACD line has been consistently above the signal line, with both lines showing an upward trend, suggesting bullish momentum.
- Conclusion: The trend indicators point towards an upward trend in the stock price.
Momentum Analysis:
- RSI: The Relative Strength Index (RSI) has been in the range of 60-70, indicating a neutral to slightly bullish momentum.
- Stochastic Oscillator: Both %K and %D have been in the overbought zone, suggesting a potential reversal or consolidation.
- Conclusion: The momentum indicators suggest a neutral to slightly bullish sentiment in the stock.
Volatility Analysis:
- Bollinger Bands (BB): The stock price has been trading within the Bollinger Bands, with the bands narrowing, indicating decreasing volatility.
- Conclusion: Volatility indicators signal a decreasing volatility in the stock price.
Volume Analysis:
- On-Balance Volume (OBV): The OBV has shown a slight increase over the last 5 days, indicating accumulation by investors.
- Chaikin Money Flow (CMF): The CMF has been fluctuating around the zero line, suggesting a balance between buying and selling pressure.
- Conclusion: Volume indicators imply a neutral sentiment in terms of volume accumulation.
Overall Conclusion:
Based on the analysis of trend, momentum, volatility, and volume indicators, the overall outlook for NSI stock in the next few days is as follows: - Trend: The trend indicators suggest an upward trajectory. - Momentum: Momentum indicators indicate a neutral to slightly bullish sentiment. - Volatility: Volatility indicators point towards a decreasing volatility. - Volume: Volume indicators imply a neutral volume accumulation.
Final Recommendation:
Considering the overall analysis, it is likely that NSI stock will continue its upward trend in the coming days with a neutral to slightly bullish momentum. However, investors should be cautious of a potential reversal or consolidation as indicated by the overbought levels in the stochastic oscillator. It is advisable to closely monitor the price action and key support/resistance levels for timely decision-making.