Technical Analysis of NTSX 2024-05-10
Overview:
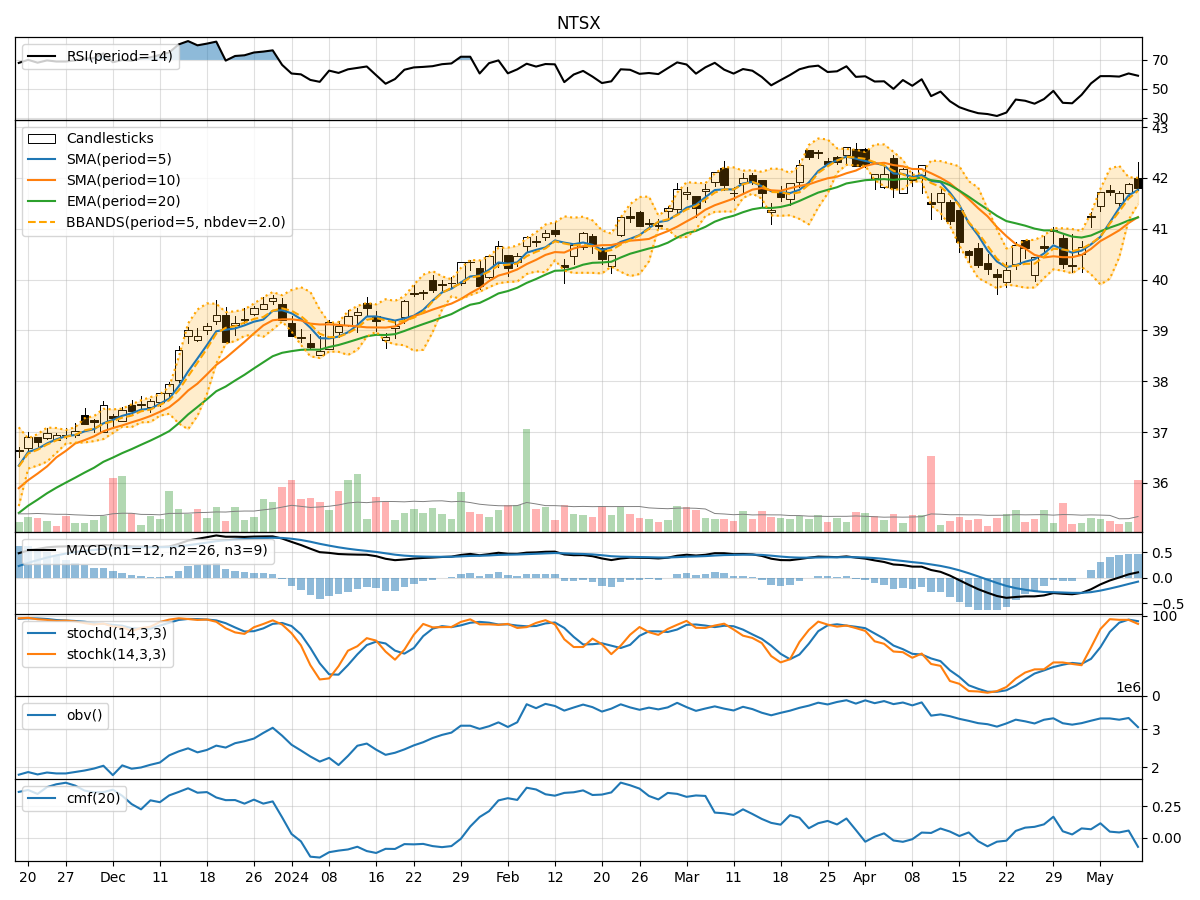
In analyzing the technical indicators for NTSX over the last 5 days, we will delve into the trend, momentum, volatility, and volume indicators to provide a comprehensive outlook on the possible stock price movement. By examining these key aspects, we aim to offer valuable insights and predictions for the upcoming days.
Trend Indicators:
- Moving Averages (MA): The 5-day MA has been consistently above the closing price, indicating a bullish trend.
- MACD: The MACD line has been positive and increasing, suggesting upward momentum.
- EMA: The EMA has been trending upwards, supporting a bullish sentiment.
Momentum Indicators:
- RSI: The RSI has been fluctuating around the neutral zone, indicating indecision in the market.
- Stochastic Oscillator: Both %K and %D have been in overbought territory, signaling a potential reversal.
- Williams %R: The indicator has been in oversold territory, suggesting a possible buying opportunity.
Volatility Indicators:
- Bollinger Bands: The bands have been narrowing, indicating decreasing volatility.
- Bollinger %B: The %B has been hovering around 0.5, reflecting a balanced market sentiment.
Volume Indicators:
- On-Balance Volume (OBV): The OBV has been fluctuating, suggesting mixed buying and selling pressure.
- Chaikin Money Flow (CMF): The CMF has been positive but declining, indicating weakening buying pressure.
Key Observations:
- The trend indicators point towards a bullish sentiment with moving averages and MACD supporting upward momentum.
- Momentum indicators show mixed signals with RSI indicating indecision, while stochastic and Williams %R suggest a potential reversal.
- Volatility indicators reflect decreasing volatility, which could lead to a period of consolidation.
- Volume indicators show mixed buying and selling pressure, with OBV fluctuating and CMF weakening.
Conclusion:
Based on the analysis of the technical indicators, the next few days for NTSX could see sideways movement or consolidation as the market digests the recent bullish trend. Traders should exercise caution and wait for clearer signals from momentum indicators before making significant trading decisions. It is advisable to closely monitor key support and resistance levels for potential breakout or reversal opportunities.