Technical Analysis of NUHY 2024-05-10
Overview:
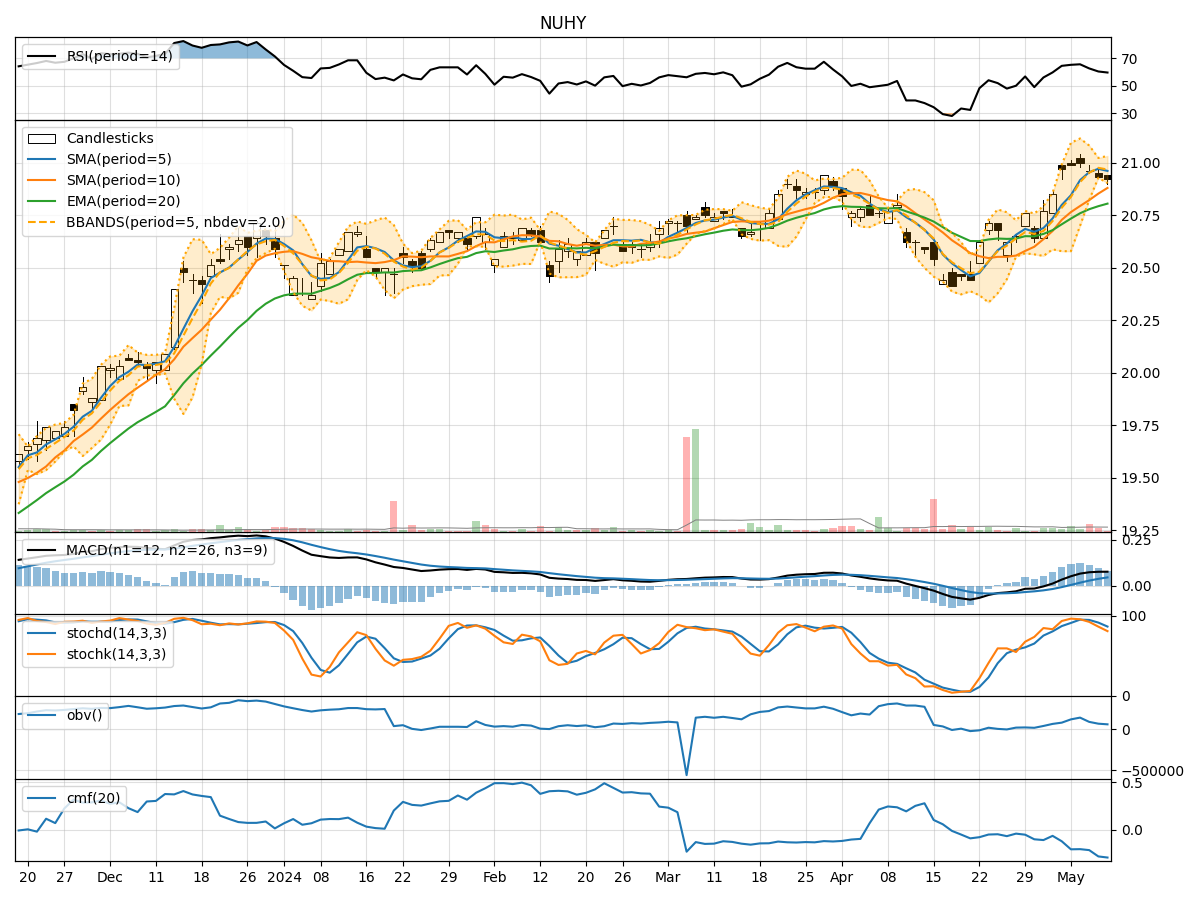
In analyzing the technical indicators for NUHY over the last 5 days, we will delve into the trend, momentum, volatility, and volume indicators to provide a comprehensive assessment of the stock's potential price movement. By examining these key factors, we aim to offer valuable insights and predictions for the next few days.
Trend Analysis:
- Moving Averages (MA): The 5-day Moving Average (MA) has been consistently above the Simple Moving Average (SMA) and Exponential Moving Average (EMA), indicating a short-term uptrend.
- MACD: The MACD line has been positive and above the signal line, suggesting bullish momentum in the stock price.
- MACD Histogram: The MACD Histogram has been increasing, indicating strengthening bullish momentum.
Momentum Analysis:
- RSI: The Relative Strength Index (RSI) has been in the neutral zone around 60, indicating neither overbought nor oversold conditions.
- Stochastic Oscillator: Both %K and %D lines of the Stochastic Oscillator have been declining, signaling a potential reversal in momentum.
- Williams %R: The Williams %R is in the oversold territory, suggesting a possible upcoming price reversal.
Volatility Analysis:
- Bollinger Bands: The stock price has been trading within the Bollinger Bands, with the bands narrowing, indicating decreasing volatility.
- Bollinger %B: The %B indicator is below 1, suggesting the price is closer to the lower band, potentially indicating a buying opportunity.
Volume Analysis:
- On-Balance Volume (OBV): The OBV has been fluctuating, indicating indecision among investors regarding the stock.
- Chaikin Money Flow (CMF): The CMF has been negative, suggesting outflow of money from the stock.
Conclusion:
Based on the analysis of the technical indicators, the next few days' possible stock price movement for NUHY could be sideways with a slight bearish bias. The trend indicators show a bullish sentiment, while the momentum indicators signal a potential reversal in momentum. The volatility indicators suggest decreasing volatility, and the volume indicators indicate indecision among investors.
Considering all these factors, it is advisable to exercise caution in trading NUHY in the next few days. Traders may consider waiting for more clarity in price direction before making significant trading decisions.