Technical Analysis of NULC 2024-05-10
Overview:
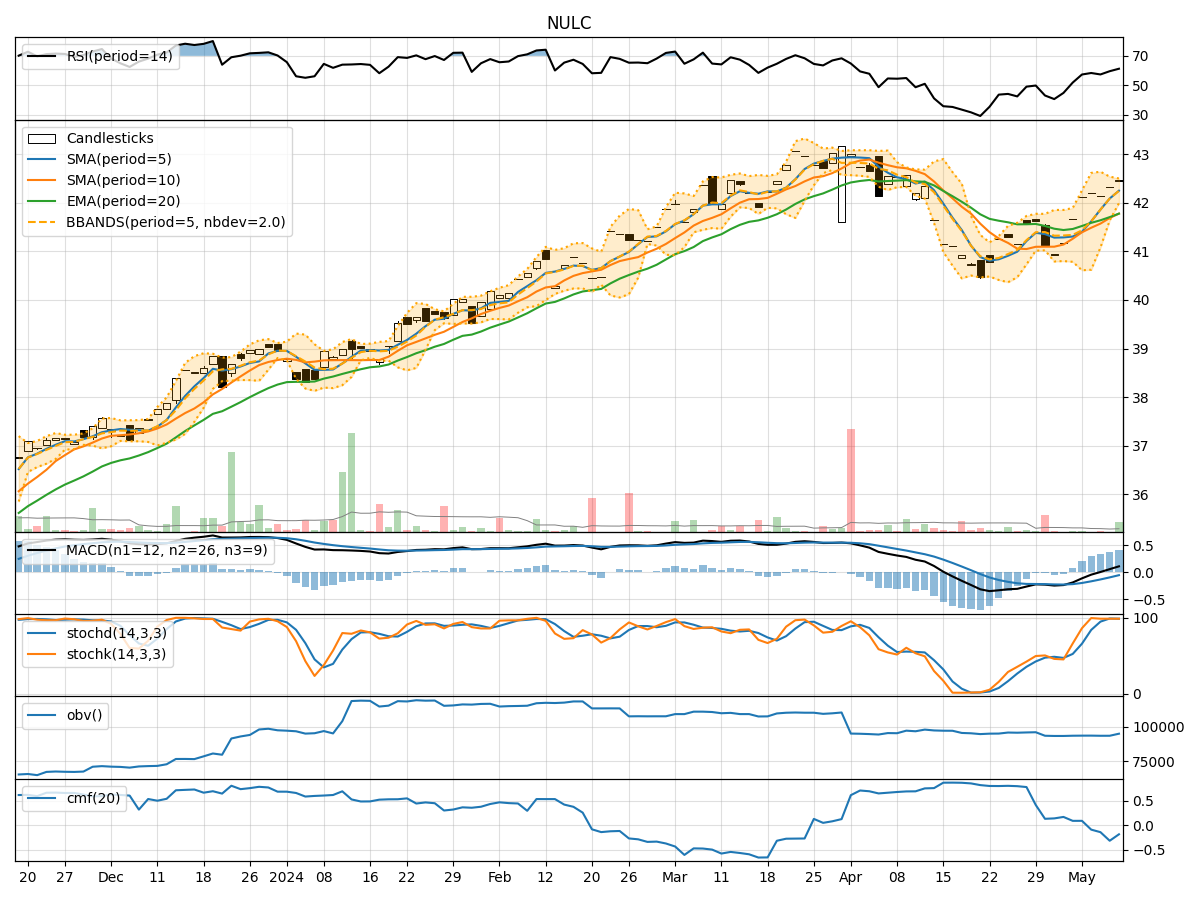
In analyzing the technical indicators for NULC over the last 5 days, we will delve into the trend, momentum, volatility, and volume indicators to provide a comprehensive outlook on the possible stock price movement. By examining these key aspects, we aim to offer valuable insights and predictions for the upcoming days.
Trend Analysis:
- Moving Averages (MA): The 5-day Moving Average (MA) has been consistently above the Simple Moving Average (SMA) and Exponential Moving Average (EMA), indicating a bullish trend.
- MACD: The MACD line has been consistently above the signal line, with both lines showing an upward trend, suggesting bullish momentum.
- Conclusion: The trend indicators point towards an upward trajectory for NULC.
Momentum Analysis:
- RSI: The Relative Strength Index (RSI) has been increasing over the last 5 days, indicating strengthening momentum.
- Stochastic Oscillator: Both %K and %D have been consistently high, suggesting strong buying pressure.
- Conclusion: Momentum indicators signal a bullish sentiment for NULC.
Volatility Analysis:
- Bollinger Bands (BB): The stock price has been trading within the Bollinger Bands, with the bands narrowing over time, indicating decreasing volatility.
- Conclusion: Volatility indicators suggest a consolidation phase for NULC.
Volume Analysis:
- On-Balance Volume (OBV): The OBV has been fluctuating but has not shown a clear trend, indicating mixed volume flow.
- Chaikin Money Flow (CMF): The CMF has been negative, suggesting a bearish money flow.
- Conclusion: Volume indicators reflect a neutral to bearish stance for NULC.
Overall Conclusion:
Based on the analysis of trend, momentum, volatility, and volume indicators, the overall outlook for NULC in the next few days is as follows: - Trend: Upward - Momentum: Bullish - Volatility: Consolidation - Volume: Neutral to Bearish
Final Recommendation:
Considering the bullish trend and momentum, along with the consolidation in volatility, there is a high probability of NULC experiencing further upward movement in the next few days. However, the neutral to bearish volume signals caution, suggesting the need for close monitoring of volume dynamics. Traders may consider buying opportunities in line with the bullish trend, but should remain vigilant for any signs of volume weakness that could impact price movements.