Technical Analysis of NULV 2024-05-10
Overview:
In analyzing the technical indicators for NULV stock over the last 5 days, we will delve into the trend, momentum, volatility, and volume indicators to provide a comprehensive outlook on the possible stock price movement in the coming days. By examining these key indicators, we aim to offer valuable insights and predictions for informed decision-making.
Trend Analysis:
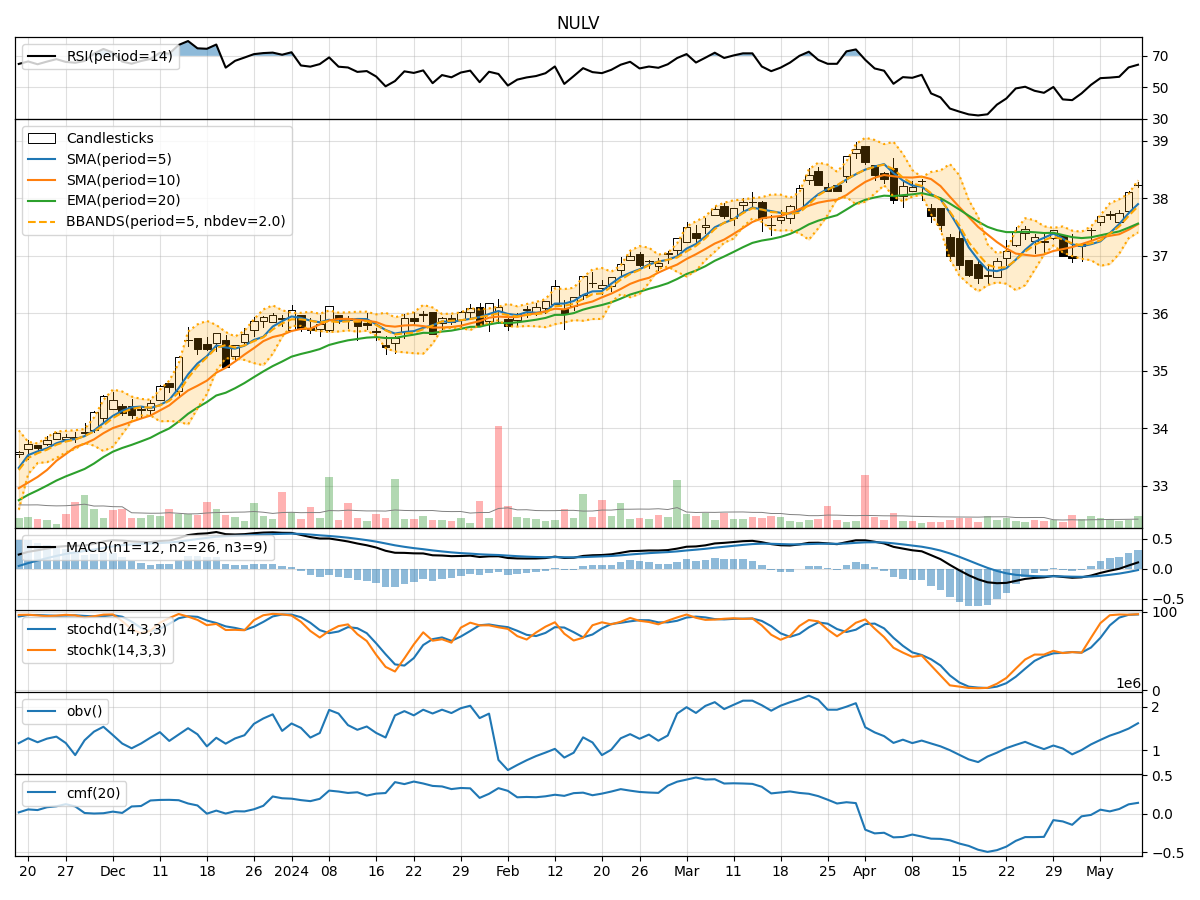
- Moving Averages (MA): The 5-day MA has been consistently above the closing prices, indicating a short-term uptrend.
- MACD: The MACD line has been positive and increasing, suggesting bullish momentum.
- RSI: The RSI has been trending upwards, indicating strengthening buying pressure.
Key Observation: The trend indicators point towards a bullish sentiment in the stock price movement.
Momentum Analysis:
- Stochastic Oscillator: Both %K and %D have been in overbought territory, signaling a potential reversal.
- Williams %R: The indicator has been fluctuating around oversold levels, suggesting a possible reversal.
Key Observation: Momentum indicators are showing signs of potential reversal or consolidation.
Volatility Analysis:
- Bollinger Bands (BB): The bands have been widening, indicating increased volatility.
- BB %B: The %B has been fluctuating within the bands, reflecting volatility in price movements.
Key Observation: Volatility has been on the rise, which could lead to significant price swings.
Volume Analysis:
- On-Balance Volume (OBV): The OBV has been steadily increasing, indicating accumulation by investors.
- Chaikin Money Flow (CMF): The CMF has been positive, suggesting buying pressure.
Key Observation: Volume indicators support the bullish sentiment with increasing accumulation and buying pressure.
Conclusion:
Based on the analysis of the technical indicators, the next few days' possible stock price movement for NULV is likely to be upward with a potential for consolidation or reversal in momentum. The bullish trend indicated by moving averages, MACD, and RSI is supported by increasing buying pressure and accumulation shown in volume indicators. However, the overbought levels in momentum indicators and rising volatility signal a need for caution as the stock may experience some consolidation or a temporary pullback before resuming its upward trajectory.
Recommendation:
Considering the overall bullish outlook but being mindful of potential reversals due to overbought conditions and increased volatility, investors may consider buying on dips or waiting for a consolidation before entering a long position. It is essential to monitor the momentum indicators closely for any signs of a trend reversal and adjust the trading strategy accordingly.