Technical Analysis of NURE 2024-05-10
Overview:
In analyzing the technical indicators for NURE stock over the last 5 days, we will delve into the trend, momentum, volatility, and volume indicators to provide a comprehensive outlook on the possible stock price movement in the coming days. By examining these key indicators, we aim to offer valuable insights and predictions for potential investors.
Trend Analysis:
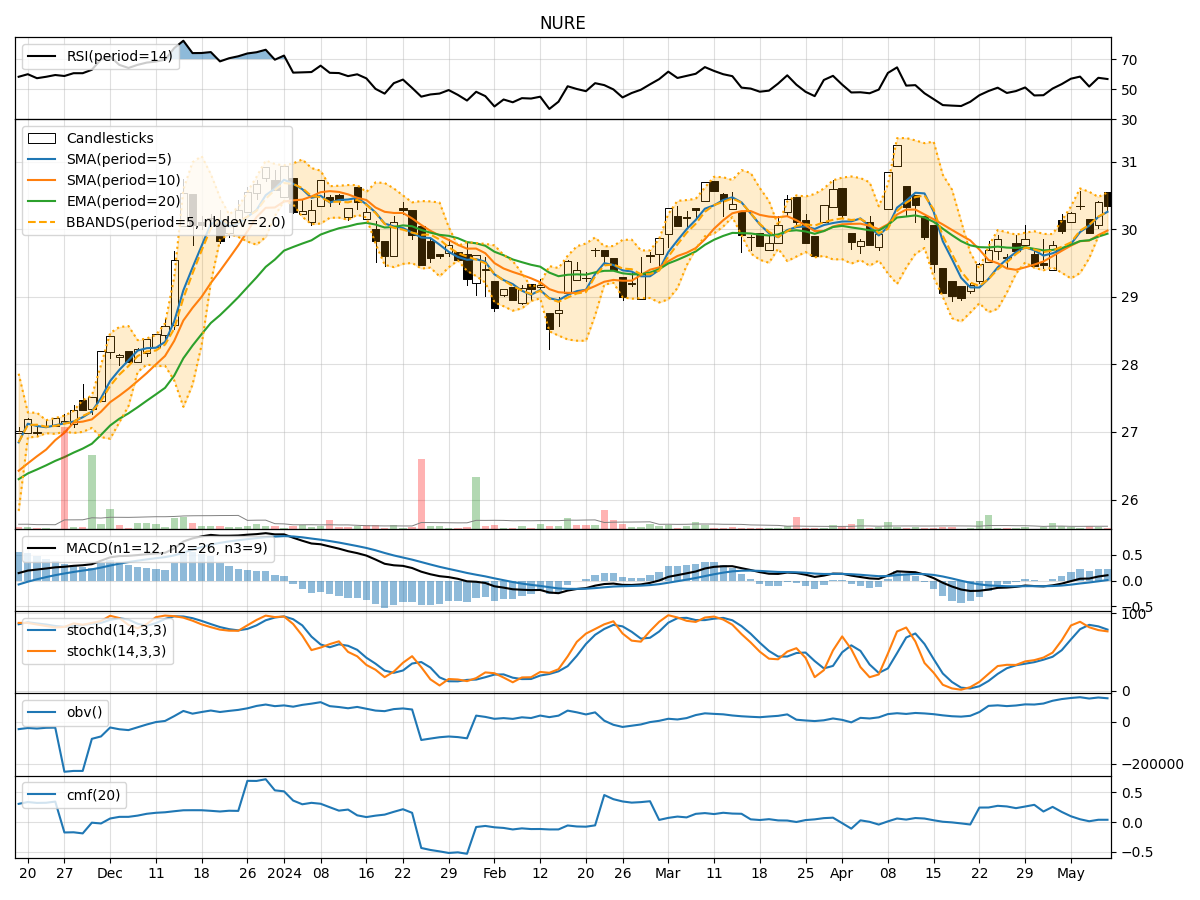
- Moving Averages (MA): The 5-day Moving Average (MA) has been consistently above the Simple Moving Average (SMA) and Exponential Moving Average (EMA), indicating a bullish trend.
- MACD: The MACD line has been consistently above the signal line, suggesting a bullish momentum in the stock price.
- RSI: The Relative Strength Index (RSI) has been fluctuating around the 50 level, indicating a neutral stance in terms of momentum.
Momentum Analysis:
- Stochastic Oscillator: The Stochastic Oscillator has been hovering around the overbought territory, suggesting a potential reversal or consolidation in the stock price.
- Williams %R: The Williams %R indicator has been fluctuating in the oversold territory, indicating a potential buying opportunity.
Volatility Analysis:
- Bollinger Bands: The Bollinger Bands have been relatively narrow, indicating low volatility in the stock price.
- Average True Range (ATR): The ATR value has been relatively stable, suggesting a consistent level of volatility in the stock.
Volume Analysis:
- On-Balance Volume (OBV): The OBV indicator has been fluctuating, indicating mixed buying and selling pressure in the stock.
- Chaikin Money Flow (CMF): The CMF has been positive, suggesting a potential inflow of money into the stock.
Key Observations:
- The trend indicators suggest a bullish sentiment in the stock price.
- Momentum indicators show a mixed signal with potential for a reversal or consolidation.
- Volatility remains relatively low, indicating stability in the stock price.
- Volume indicators reflect mixed buying and selling pressure in the stock.
Conclusion:
Based on the analysis of the technical indicators, the stock price of NURE is likely to experience further upward movement in the coming days. The bullish trend indicated by moving averages and MACD, coupled with the positive CMF, suggests a favorable outlook for the stock. However, investors should remain cautious of potential reversals indicated by the Stochastic Oscillator and Williams %R. Overall, the stock shows signs of strength and potential for continued growth in the short term.