Technical Analysis of NUSI 2024-05-10
Overview:
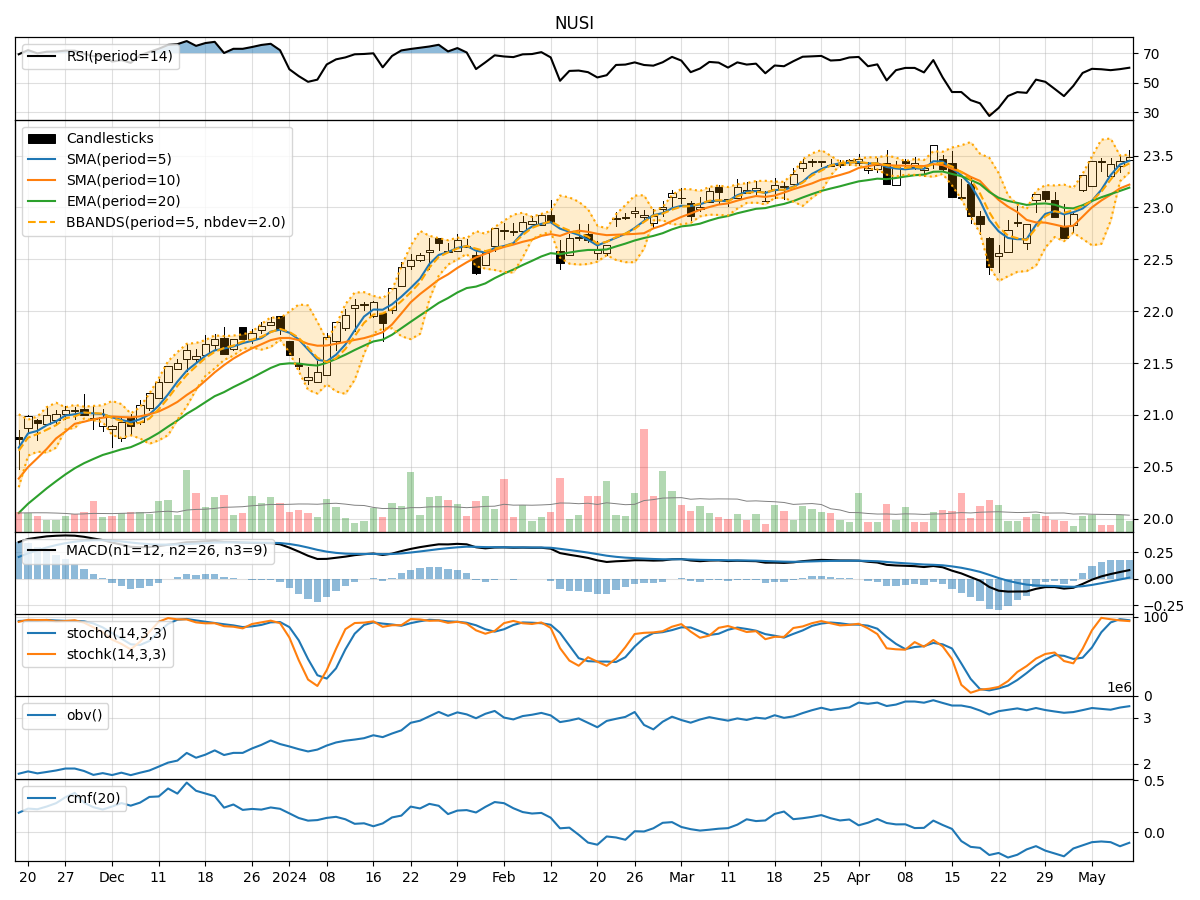
In analyzing the technical indicators for NUSI over the last 5 days, we will delve into the trend, momentum, volatility, and volume indicators to provide a comprehensive outlook on the possible stock price movement in the coming days. By examining these key indicators, we aim to offer valuable insights and predictions for informed decision-making.
Trend Indicators:
- Moving Averages (MA): The 5-day MA has been consistently above the closing prices, indicating a short-term uptrend.
- MACD: The MACD line has been above the signal line, suggesting bullish momentum.
- RSI: The RSI has been fluctuating around the 60-70 range, indicating a neutral to slightly bullish sentiment.
Key Observation: The trend indicators point towards a bullish bias in the short term.
Momentum Indicators:
- Stochastic Oscillator: Both %K and %D have been in overbought territory, signaling potential for a reversal.
- Williams %R: The indicator has been in oversold territory, suggesting a possible buying opportunity.
Key Observation: Momentum indicators show conflicting signals, with stochastic indicating a potential reversal while Williams %R suggests a buying opportunity.
Volatility Indicators:
- Bollinger Bands (BB): The stock price has been trading within the bands, indicating normal volatility.
- BB% (Bollinger Band %B): The %B has been fluctuating around 0.5, suggesting equilibrium between volatility and price.
Key Observation: Volatility indicators suggest a stable price movement within the Bollinger Bands.
Volume Indicators:
- On-Balance Volume (OBV): The OBV has shown a slight increase, indicating accumulation.
- Chaikin Money Flow (CMF): The CMF has been negative, signaling outflows.
Key Observation: Volume indicators show mixed signals with OBV indicating accumulation while CMF suggests outflows.
Conclusion:
Based on the analysis of the technical indicators, the next few days' possible stock price movement for NUSI is likely to be bullish in the short term. The trend indicators support a bullish bias, while momentum indicators show conflicting signals that may lead to a consolidation phase. Volatility indicators suggest stable price movement within the Bollinger Bands, and volume indicators indicate a mix of accumulation and outflows.
Overall, the stock is poised for a potential upward movement, but traders should remain cautious of potential reversals indicated by the momentum indicators.