Technical Analysis of NVDD 2024-05-10
Overview:
In analyzing the technical indicators for NVDD over the last 5 days, we will delve into the trend, momentum, volatility, and volume indicators to provide a comprehensive outlook on the possible stock price movement in the coming days. By examining these key aspects, we aim to offer valuable insights and predictions for informed decision-making.
Trend Analysis:
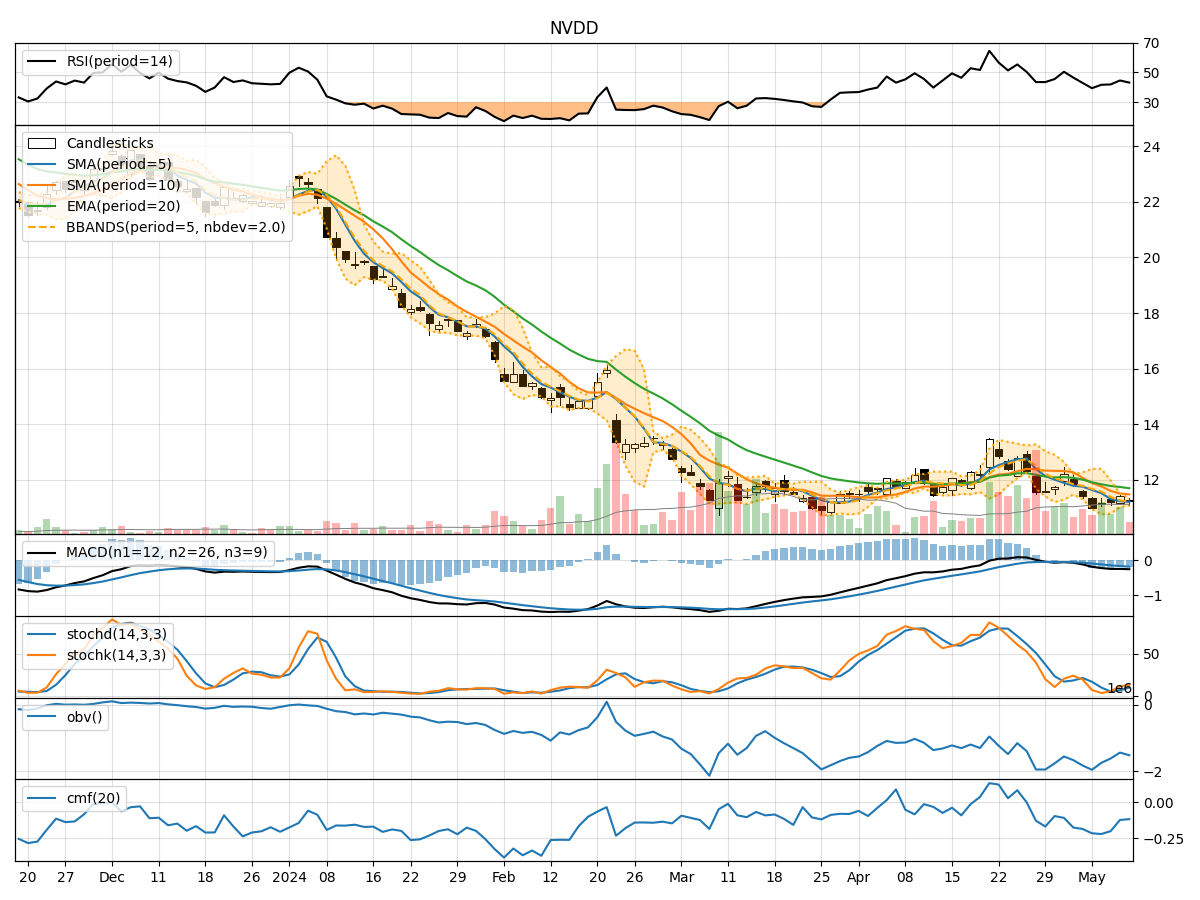
- Moving Averages (MA): The 5-day MA has been consistently below the closing prices, indicating a downward trend.
- MACD: The MACD line has been negative, with the MACD histogram showing a decreasing trend, signaling bearish momentum.
Momentum Analysis:
- RSI: The RSI values have been relatively low, suggesting a lack of strong buying momentum.
- Stochastic Oscillator: Both %K and %D values have been below 20, indicating oversold conditions.
Volatility Analysis:
- Bollinger Bands (BB): The stock price has been trading below the lower Bollinger Band, indicating oversold conditions.
Volume Analysis:
- On-Balance Volume (OBV): The OBV values have been negative, reflecting selling pressure.
- Chaikin Money Flow (CMF): The CMF values have been consistently negative, indicating a lack of buying interest.
Key Observations:
- The stock is currently in a downtrend based on moving averages and MACD analysis.
- Momentum indicators suggest oversold conditions with low RSI and stochastic values.
- Volatility indicators point towards increased selling pressure with the stock trading below the lower Bollinger Band.
- Volume indicators reflect negative OBV and CMF values, indicating a lack of buying interest.
Conclusion:
Based on the analysis of the technical indicators, the next few days' possible stock price movement for NVDD is likely to be bearish. The stock is expected to continue its downward trend, potentially experiencing further selling pressure and remaining in oversold conditions. Traders and investors should exercise caution and consider waiting for signs of a reversal before considering any long positions.