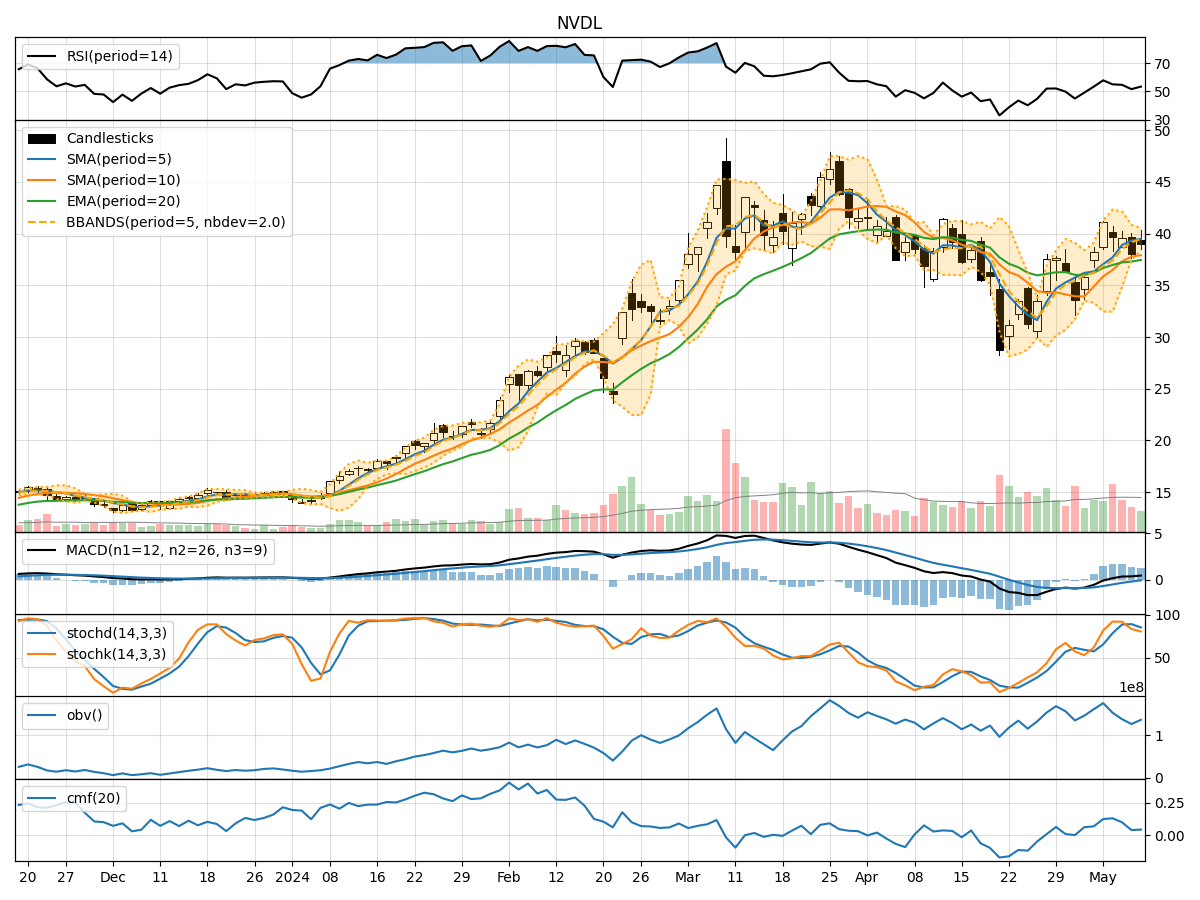
Technical Analysis of NVDL 2024-05-10
Overview:
In the last 5 trading days, NVDL stock has shown mixed signals across various technical indicators. The stock price has fluctuated within a range, with some indicators suggesting bullish momentum while others indicating potential weakness. By analyzing trend, momentum, volatility, and volume indicators, we can gain a comprehensive understanding of the stock's potential future price movement.
Trend Indicators:
- Moving averages (MA) have been trending upwards, indicating a positive momentum in the short term.
- MACD (Moving Average Convergence Divergence) has shown positive values, suggesting a bullish trend.
- EMA (Exponential Moving Average) has been rising steadily, supporting the bullish sentiment.
Momentum Indicators:
- RSI (Relative Strength Index) has been fluctuating but generally staying within the neutral range, indicating a lack of strong momentum.
- Stochastic indicators have shown some overbought conditions, which might lead to a potential pullback.
- Williams %R (Willams Percentage Range) has been hovering around oversold levels, signaling a possible reversal.
Volatility Indicators:
- Bollinger Bands have widened, indicating increased volatility in the stock price.
- The stock has been trading near the upper Bollinger Band, suggesting a potential overbought condition.
- Volatility indicators imply that the stock may experience sharp price movements in the near term.
Volume Indicators:
- On-Balance Volume (OBV) has been relatively stable, indicating a balance between buying and selling pressure.
- Chaikin Money Flow (CMF) has shown a slight increase, suggesting some accumulation in the stock.
Conclusion:
Based on the analysis of technical indicators, the next few days' possible stock price movement for NVDL is likely to experience a short-term pullback or consolidation. While trend indicators suggest a bullish sentiment, momentum indicators point towards a potential reversal or correction due to overbought conditions. Volatility indicators indicate the possibility of sharp price movements, while volume indicators show a balanced market sentiment.
Key Points: - Trend: Upward - Momentum: Neutral to Bearish - Volatility: High - Volume: Balanced
Considering the mixed signals from different indicators, it is essential for traders and investors to exercise caution and closely monitor the stock's price action. A prudent approach would be to wait for a clearer trend confirmation before making significant trading decisions.