Technical Analysis of NVIR 2024-05-10
Overview:
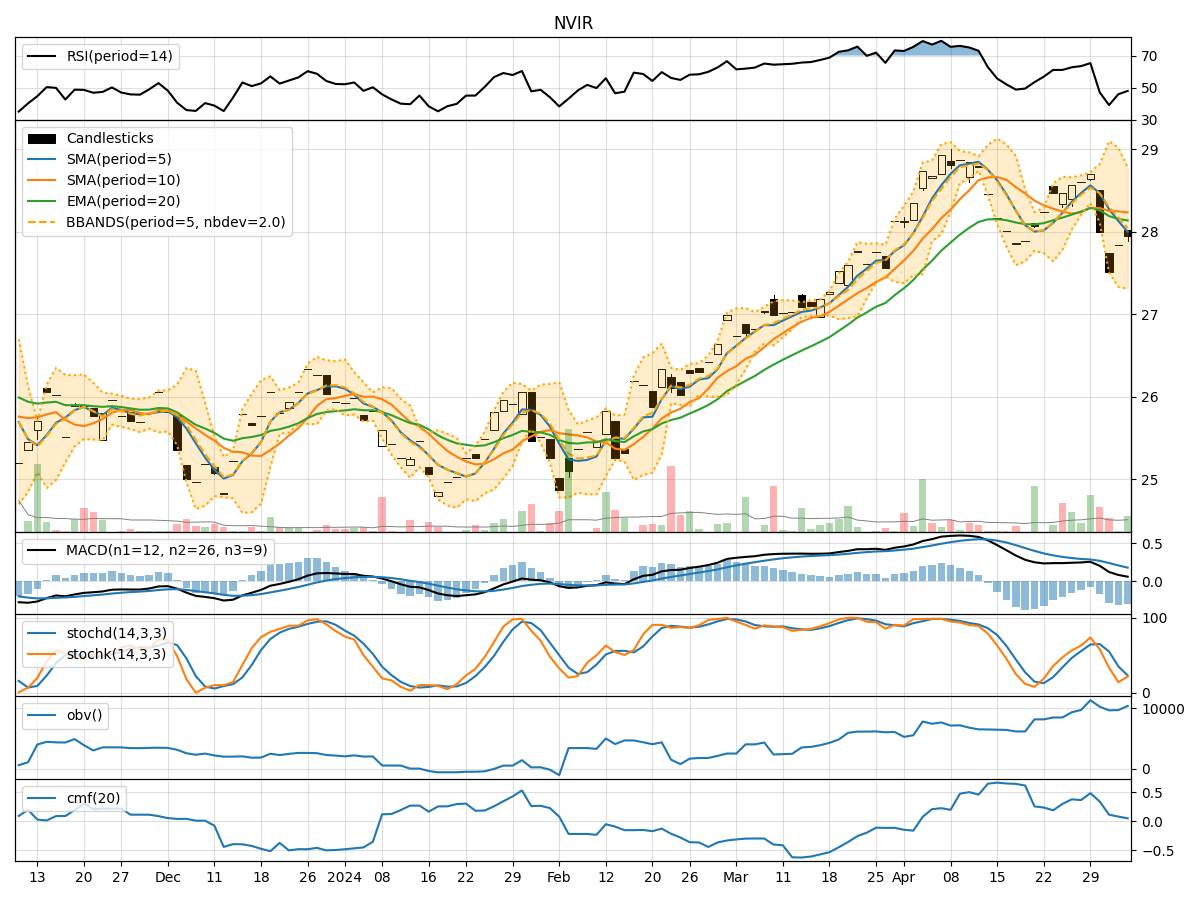
In analyzing the technical indicators for NVIR over the last 5 days, we will delve into the trend, momentum, volatility, and volume indicators to provide a comprehensive outlook on the possible stock price movement in the coming days. By examining these key indicators, we aim to offer valuable insights and predictions for potential investors.
Trend Indicators:
- Moving Averages (MA): The 5-day MA has been consistently above the closing prices, indicating a short-term uptrend.
- MACD: The MACD line has been positive, suggesting bullish momentum.
- MACD Histogram: The histogram has been decreasing but remains above the zero line, indicating a potential slowdown in the uptrend.
Momentum Indicators:
- RSI: The RSI has been fluctuating around the neutral 50 level, indicating a lack of strong momentum.
- Stochastic Oscillator: Both %K and %D have been in overbought territory, suggesting a potential reversal or consolidation.
- Williams %R: The indicator has been hovering in the oversold region, signaling a possible buying opportunity.
Volatility Indicators:
- Bollinger Bands: The stock price has been trading within the bands, suggesting a period of consolidation.
- Bollinger %B: The %B indicator has been fluctuating around 0.5, indicating a balanced market sentiment.
Volume Indicators:
- On-Balance Volume (OBV): The OBV has been relatively flat, indicating a lack of significant buying or selling pressure.
- Chaikin Money Flow (CMF): The CMF has been positive but trending downwards, suggesting weakening buying pressure.
Key Observations and Opinions:
- Trend: The trend indicators suggest a short-term uptrend, supported by the positive MACD. However, the decreasing MACD histogram may signal a potential slowdown in momentum.
- Momentum: The momentum indicators show mixed signals, with the RSI indicating neutrality, while the stochastic oscillator and Williams %R suggest potential reversals or consolidation.
- Volatility: The Bollinger Bands and %B indicator point towards a period of consolidation, with the stock price trading within the bands.
- Volume: The volume indicators indicate a lack of significant buying or selling pressure, with the OBV remaining flat and the CMF showing weakening buying pressure.
Conclusion:
Based on the analysis of the technical indicators, the next few days for NVIR could see sideways movement or consolidation as the stock price continues to trade within the Bollinger Bands. The mixed signals from the momentum indicators suggest a potential lack of strong directional bias. Traders may need to exercise caution and wait for clearer signals before making significant trading decisions.