Technical Analysis of NXTE 2024-05-10
Overview:
In analyzing the technical indicators for NXTE over the last 5 days, we will delve into the trend, momentum, volatility, and volume indicators to provide a comprehensive outlook on the possible stock price movement. By examining these key aspects, we aim to offer valuable insights and predictions for the upcoming days.
Trend Analysis:
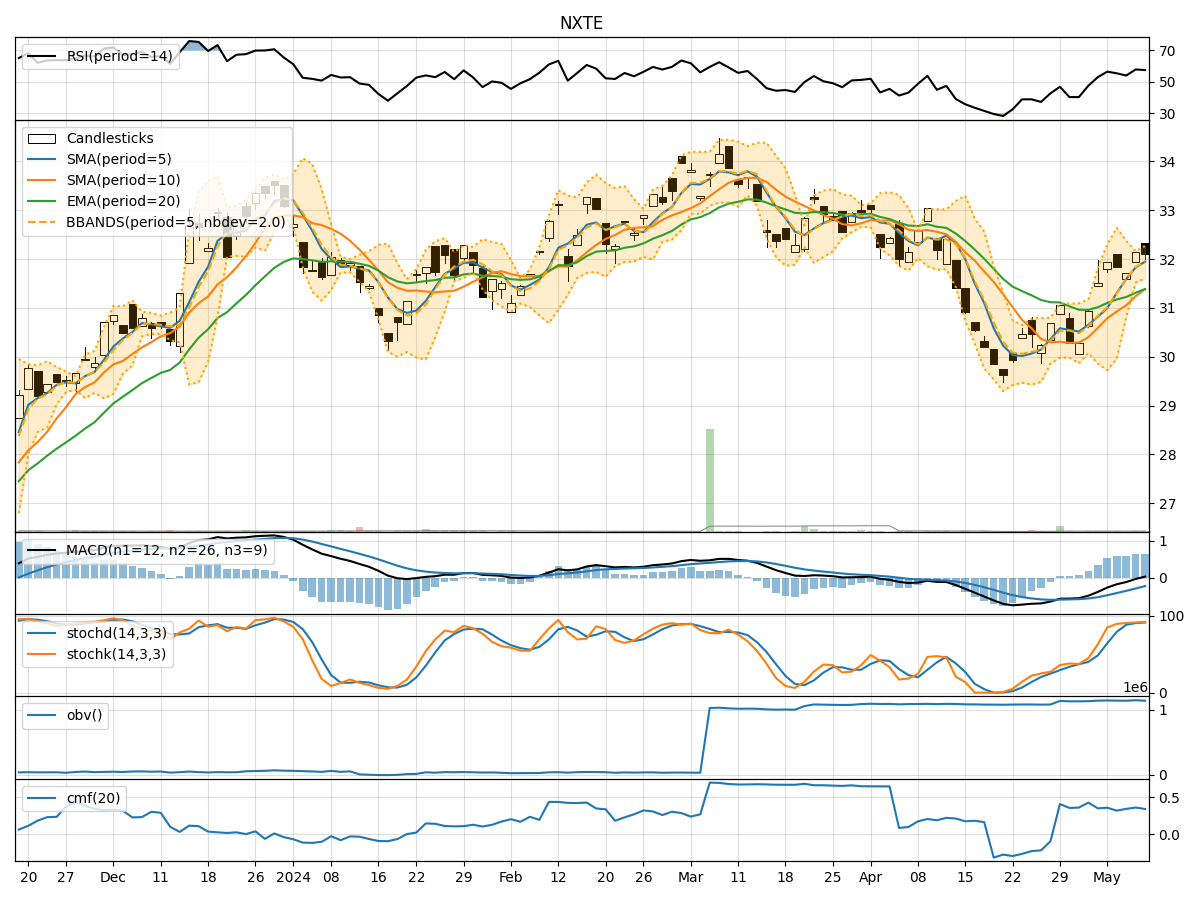
- Moving Averages (MA): The 5-day Moving Average (MA) has been consistently above the Simple Moving Average (SMA) and Exponential Moving Average (EMA), indicating a bullish trend.
- MACD: The Moving Average Convergence Divergence (MACD) has shown positive values, with the MACD line above the Signal line, suggesting upward momentum.
Momentum Analysis:
- RSI: The Relative Strength Index (RSI) has been fluctuating around the 50 level, indicating a neutral momentum.
- Stochastic Oscillator: Both %K and %D have been in the overbought zone, suggesting a potential reversal or consolidation.
Volatility Analysis:
- Bollinger Bands (BB): The stock price has mostly remained within the Bollinger Bands, with the %B indicator hovering around the midline, indicating moderate volatility.
Volume Analysis:
- On-Balance Volume (OBV): The OBV has shown slight fluctuations but has not diverged significantly from the price movement, indicating a balanced volume trend.
- Chaikin Money Flow (CMF): The CMF has been positive, reflecting buying pressure in the stock.
Key Observations:
- The trend indicators suggest a bullish sentiment, supported by the positive MACD values.
- Momentum indicators show a neutral stance, with the RSI around the midpoint and stochastic indicators in the overbought zone.
- Volatility remains moderate, as indicated by the Bollinger Bands.
- Volume indicators reflect a balanced volume trend, with slight fluctuations in OBV and positive CMF values.
Conclusion:
Based on the analysis of the technical indicators, the stock price of NXTE is likely to experience further upward movement in the next few days. The bullish trend supported by the positive MACD values and moving averages indicates a potential continuation of the uptrend. While momentum indicators suggest a neutral stance, the overall picture remains positive. Therefore, investors may consider buying or holding positions in NXTE for potential gains in the upcoming trading sessions.