Technical Analysis of NXTG 2024-05-10
Overview:
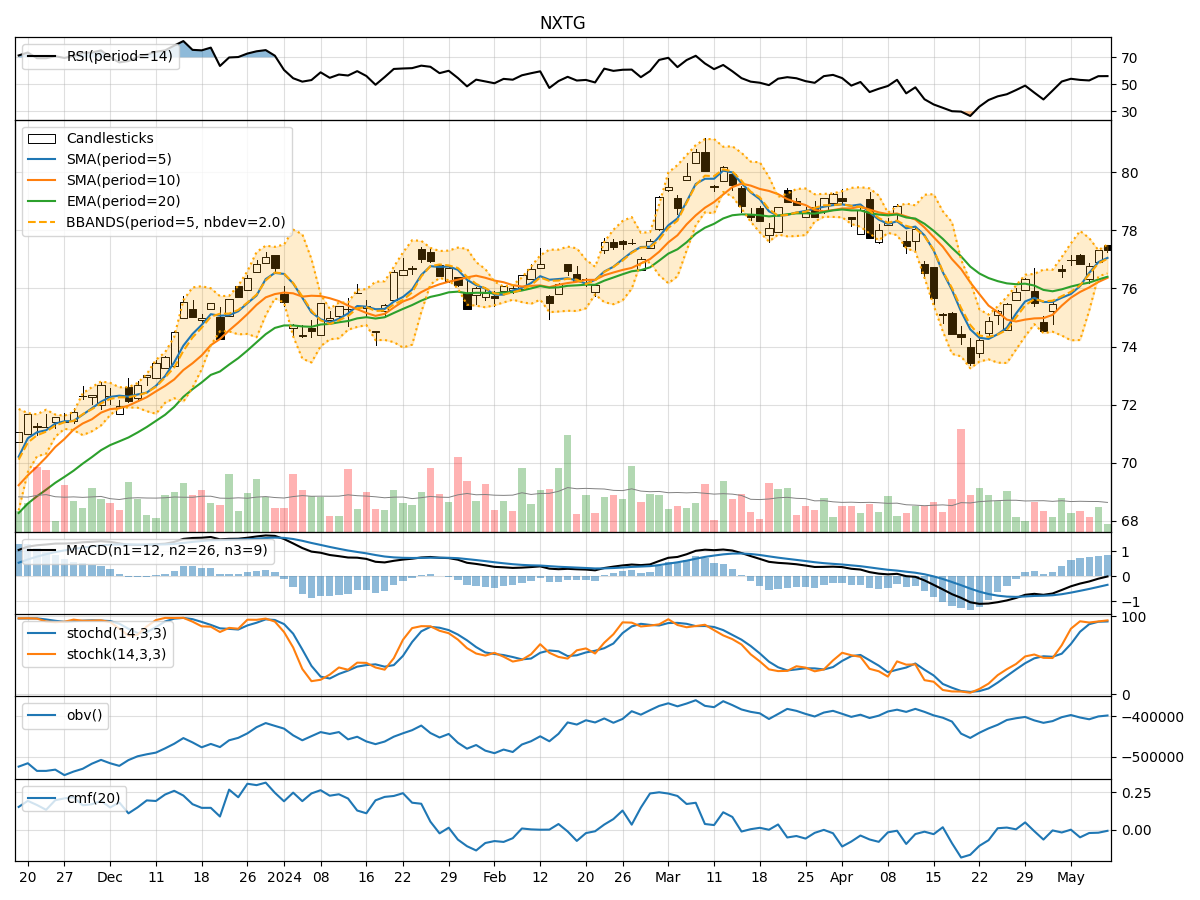
In analyzing the technical indicators for NXTG over the last 5 days, we will delve into the trend, momentum, volatility, and volume indicators to provide a comprehensive outlook on the possible stock price movement in the coming days. By examining these key aspects, we aim to offer valuable insights and predictions for investors seeking to understand the market dynamics surrounding NXTG.
Trend Analysis:
- Moving Averages (MA): The 5-day Moving Average (MA) has been consistently above the Simple Moving Average (SMA) and Exponential Moving Average (EMA), indicating a bullish trend.
- MACD: The MACD line has been consistently above the signal line, suggesting positive momentum in the stock price.
- RSI: The Relative Strength Index (RSI) has been fluctuating around the neutral zone, indicating a balanced momentum in the stock.
Momentum Analysis:
- Stochastic Oscillator: The Stochastic Oscillator has been in the overbought region, suggesting a potential reversal or consolidation in the stock price.
- Williams %R: The Williams %R indicator has been hovering around the oversold region, indicating a possible buying opportunity.
Volatility Analysis:
- Bollinger Bands: The Bollinger Bands have been relatively narrow, indicating low volatility in the stock price.
- Volatility Indicators: The volatility indicators show a decreasing trend, suggesting a stabilization in price movements.
Volume Analysis:
- On-Balance Volume (OBV): The OBV indicator has been fluctuating, indicating mixed sentiment among investors.
- Chaikin Money Flow (CMF): The CMF has been negative, suggesting a bearish outlook on the stock.
Conclusion:
Based on the analysis of the technical indicators, the stock of NXTG is likely to experience sideways movement in the coming days. The trend indicators point towards a bullish bias, supported by the moving averages and MACD. However, the momentum indicators signal a potential reversal due to overbought conditions in the Stochastic Oscillator. The volatility indicators suggest low volatility ahead, while the volume indicators indicate mixed sentiment among investors.
In conclusion, while the trend remains bullish, investors should exercise caution due to the potential reversal indicated by the momentum indicators. It is advisable to closely monitor the price action and key support/resistance levels to make informed trading decisions.