Technical Analysis of NYF 2024-05-10
Overview:
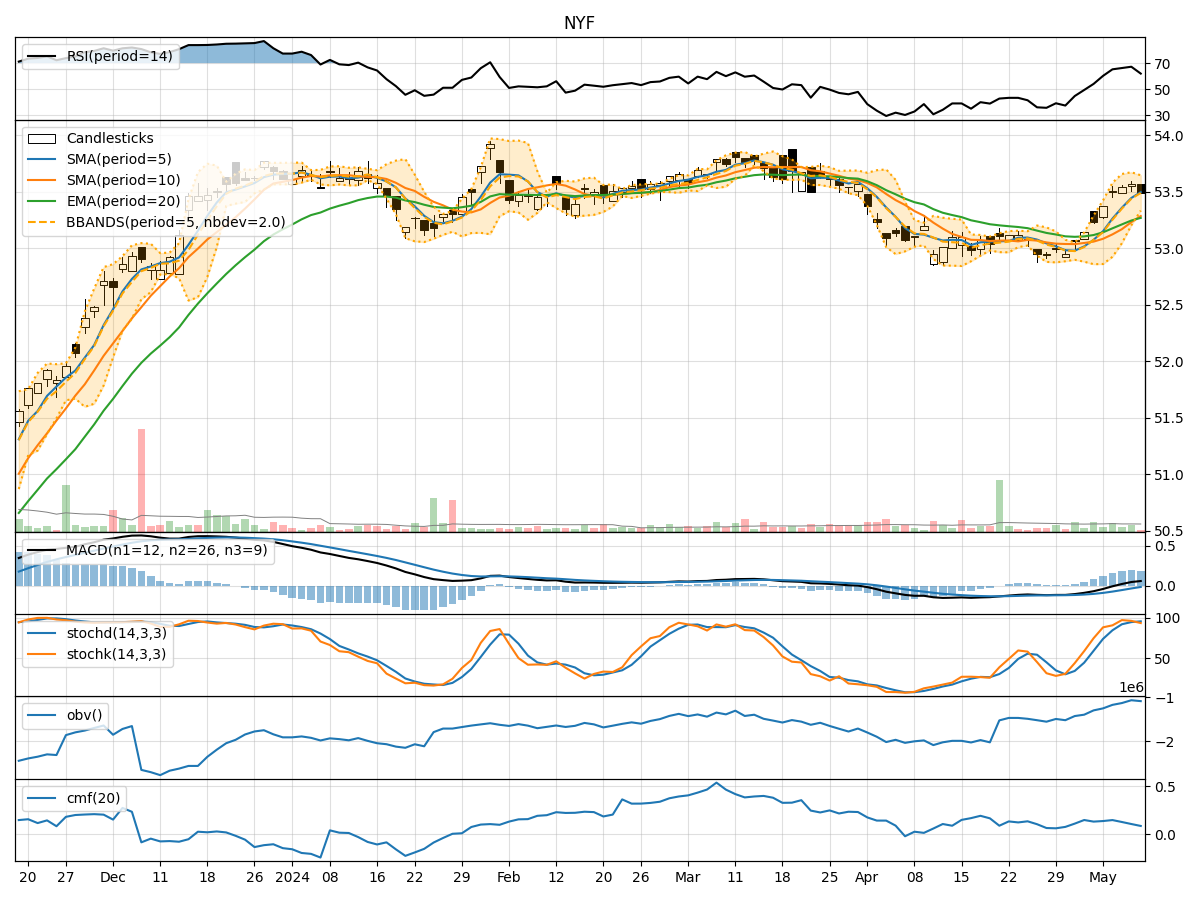
In the last 5 trading days, NYF stock has shown a consistent uptrend in its price, with slight fluctuations in volume. The trend indicators suggest a positive momentum, supported by increasing moving averages and MACD values. Momentum indicators like RSI and Stochastic oscillators indicate overbought conditions but still show strength in the current trend. Volatility indicators show narrowing Bollinger Bands, indicating potential price consolidation. Volume indicators suggest a steady accumulation of the stock.
Trend Indicators Analysis:
- Moving averages (MA) have been consistently rising, indicating a bullish trend.
- MACD values have been positive and increasing, showing strong bullish momentum.
- EMA values have been above the closing prices, supporting the uptrend.
Momentum Indicators Analysis:
- RSI values have been in the overbought territory, suggesting a potential pullback.
- Stochastic oscillators are also in the overbought zone, indicating a possible reversal.
- Williams %R is showing oversold conditions, which could lead to a short-term correction.
Volatility Indicators Analysis:
- Bollinger Bands are narrowing, indicating decreasing volatility and a potential price consolidation.
- The stock price has been trading within the bands, suggesting a period of stability.
Volume Indicators Analysis:
- On-Balance Volume (OBV) has been steadily increasing, indicating accumulation by investors.
- Chaikin Money Flow (CMF) is positive, showing buying pressure in the stock.
Key Observations:
- The stock is in a strong uptrend based on trend and momentum indicators.
- Overbought conditions in RSI and Stochastic indicators may lead to a short-term correction.
- Volatility is decreasing, suggesting a period of consolidation.
- Volume indicators support the current uptrend with steady accumulation.
Conclusion:
Based on the analysis of technical indicators, the next few days' possible stock price movement for NYF is likely to experience a short-term correction or consolidation. The overbought conditions in momentum indicators and narrowing Bollinger Bands indicate a potential pause in the uptrend. Investors should be cautious of a possible pullback in the stock price in the near term. It is advisable to monitor the price action closely for any signs of reversal or continuation of the current trend.