Technical Analysis of NZAC 2024-05-10
Overview:
In analyzing the technical indicators for NZAC over the last 5 days, we will delve into the trend, momentum, volatility, and volume indicators to provide a comprehensive outlook on the possible stock price movement in the coming days. By examining these key indicators, we aim to offer valuable insights and recommendations for potential investors.
Trend Indicators:
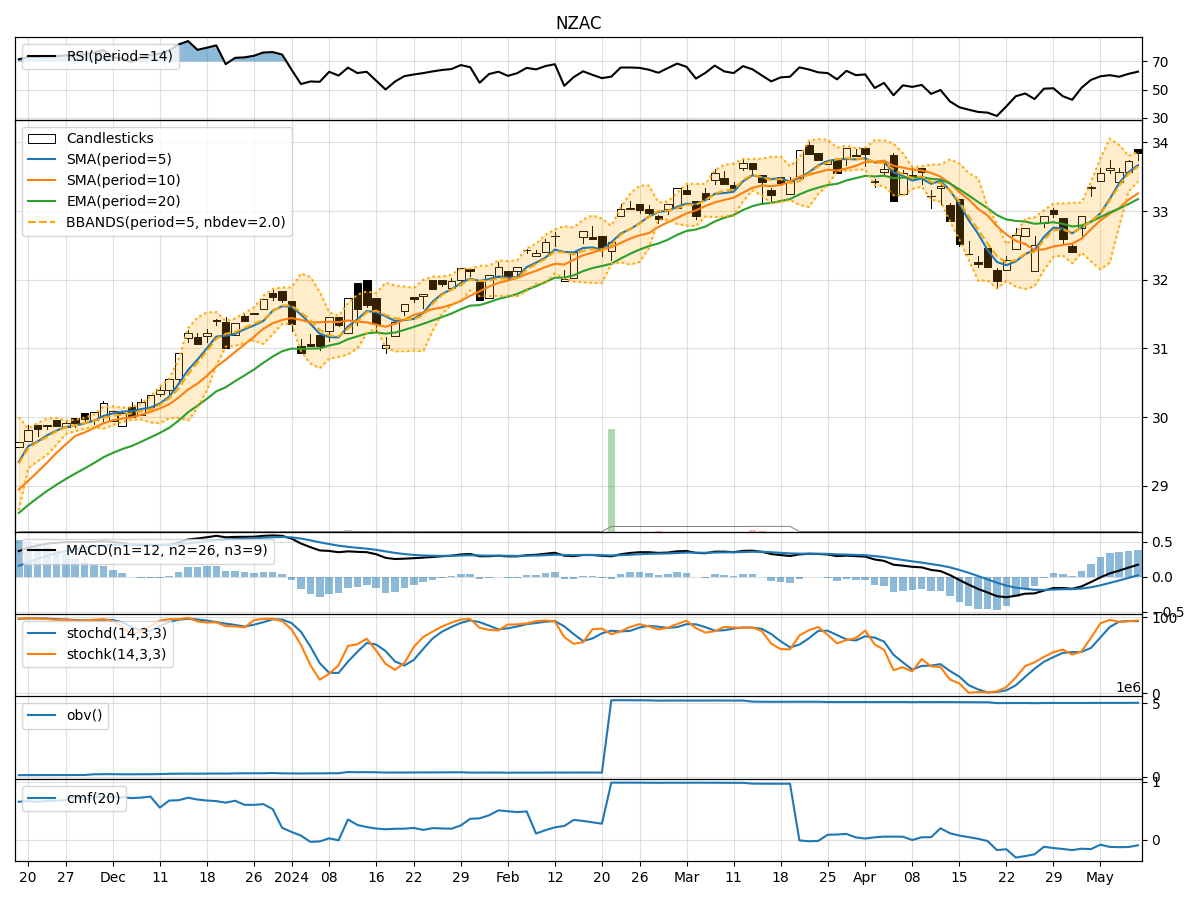
- Moving Averages (MA): The 5-day moving average has been consistently above the simple moving average (SMA) and exponential moving average (EMA), indicating a bullish trend.
- MACD: The MACD line has been consistently above the signal line, with both lines showing an upward trend, suggesting bullish momentum.
- MACD Histogram: The histogram has been increasing over the last 5 days, indicating strengthening bullish momentum.
Momentum Indicators:
- RSI: The Relative Strength Index (RSI) has been trending upwards and is currently in the overbought territory, suggesting a strong bullish momentum.
- Stochastic Oscillator: Both %K and %D lines of the Stochastic Oscillator are in the overbought zone, indicating a potential reversal or consolidation.
- Williams %R: The Williams %R is in the oversold region, signaling a potential reversal to the upside.
Volatility Indicators:
- Bollinger Bands: The stock price has been trading within the upper Bollinger Band, indicating an overbought condition.
- Bollinger Band Width: The Band Width has been narrowing, suggesting a potential decrease in volatility.
- Bollinger Band %B: The %B indicator is above 0.8, indicating a potential overbought condition.
Volume Indicators:
- On-Balance Volume (OBV): The OBV has been relatively flat over the last 5 days, suggesting a balance between buying and selling pressure.
- Chaikin Money Flow (CMF): The CMF has been negative, indicating a bearish money flow into the stock.
Conclusion:
Based on the analysis of the technical indicators, the next few days' possible stock price movement for NZAC is likely to experience a short-term consolidation or pullback. While the trend indicators suggest a bullish sentiment, the momentum indicators show signs of potential reversal or consolidation, especially with the Stochastic Oscillator in the overbought zone. The volatility indicators also point towards a decrease in volatility, further supporting a consolidation scenario. Additionally, the volume indicators indicate a balanced buying and selling pressure, reinforcing the potential for a sideways movement in the stock price.
Recommendation:
Considering the mixed signals from the technical indicators, it is advisable for investors to exercise caution and closely monitor the stock's price action in the coming days. It may be prudent to wait for clearer signals or confirmation of a new trend direction before making significant trading decisions. Conducting further analysis and staying updated on market developments will be crucial in navigating the potential price movements of NZAC.